Figure 3.
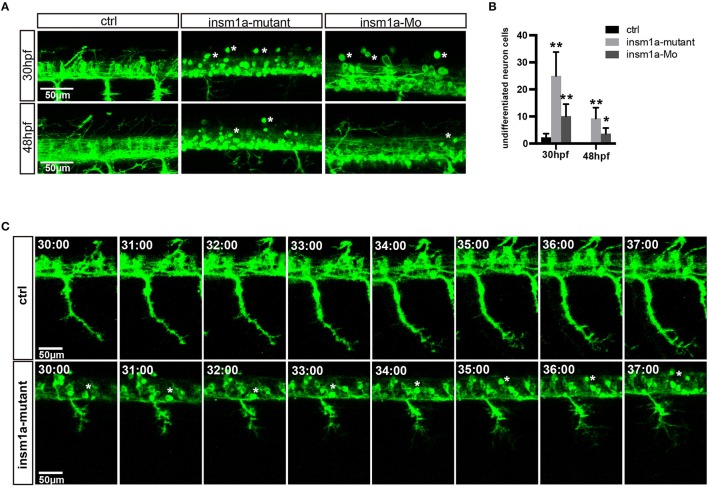
Insm1a deficiency suppressed neuronal cells differentiation. (A) Confocal imaging analysis of primary motor neuron in control group, insm1a mutant group and morphant group at 30 and 48 hpf Tg(mnx1:GFP)ml2. Phenotypes of neuronal cells in the spinal cord in control group, morphant group, and insm1a mutant groups at 30 hpf and 48 hpf. Asterisks indicate undifferentiated neuronal cells. Scale bar = 50 μm. (B) Quantification of the undifferentiated neuronal cell in the insm1a different treatment zebrafish. Asterisks above the bars indicate significant differences (*P < 0.05, **P < 0.01). (C) Time-lapse imaging analysis of the primary motor neuron in control group and insm1a mutant groups. Asterisks represent undifferentiated neuronal cells. Scale bar = 50 μm

