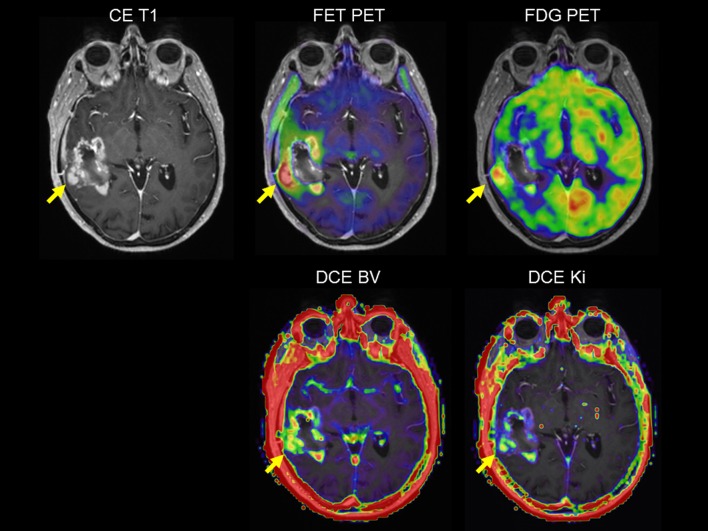
Fig. 2.
Multiparametric PET/MRI imaging. Transaxial images of glioblastoma (WHO IV) patient 2–3 weeks after surgery showing post-contrast MRI (CE T1), FET PET and FDG PET (top row), and blood volume (BV) and permeability (Ki) maps derived from dynamic contrast-enhanced (DCE) T1 MRI scans [48]. DCE allows for the separation of contrast enhancement in a blood volume (BV) and permeability (Ki) component. The physiological measures highlight different and complementary tumor characteristics. FET PET shows a superior contrast to healthy brain in delineating the tumor borders, and peak areas (yellow arrow) are not overlapping in metabolic and vascular physiological measures. FDG PET is challenged by high uptake in functioning neural tissue

