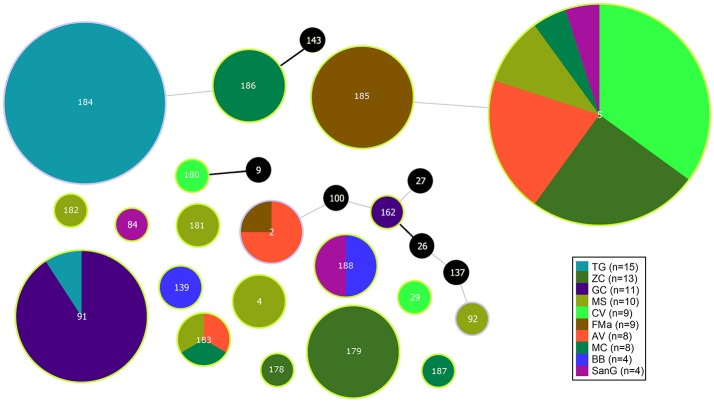
Figure 1.
eBURST diagram of S. maltophilia population. Each circle represents one ST. Diameter of circles is proportional to the number of isolates belonging to each ST. The thickness and color of the connections between STs represent the number of loci with one or more different allele (thick black link, 1 different allele; thin gray link, 2 different alleles). Black circles represent previously characterized STs which were not found in the present study.

