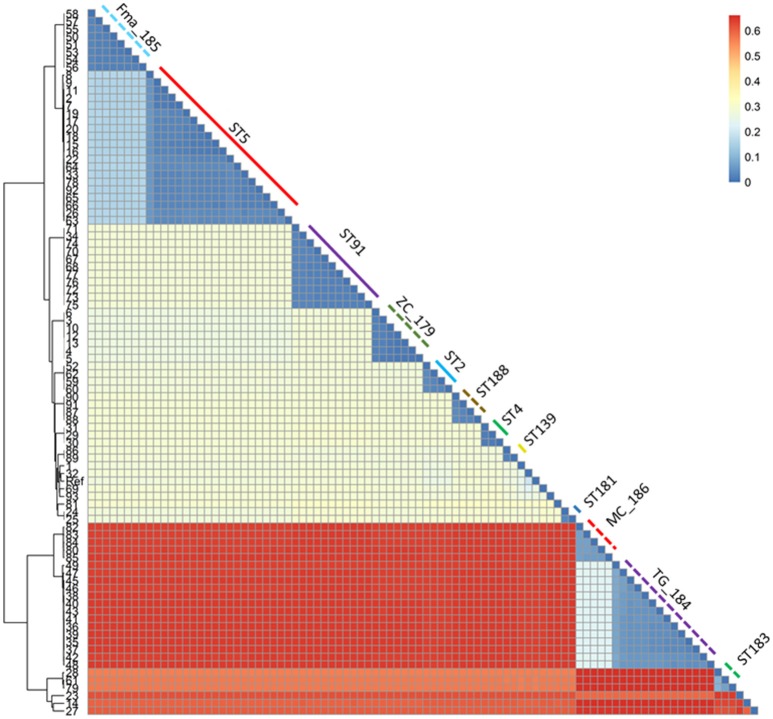
Figure 3.
Heatmap representing the phylogenetic distances as inferred by the SNP data. The clustering pattern reflects the one in Figure 2, but the distance between the two main clusters and the minor ones is highlighted. The monophyletic STs are shown with the same color and line type as in Figure 2.

