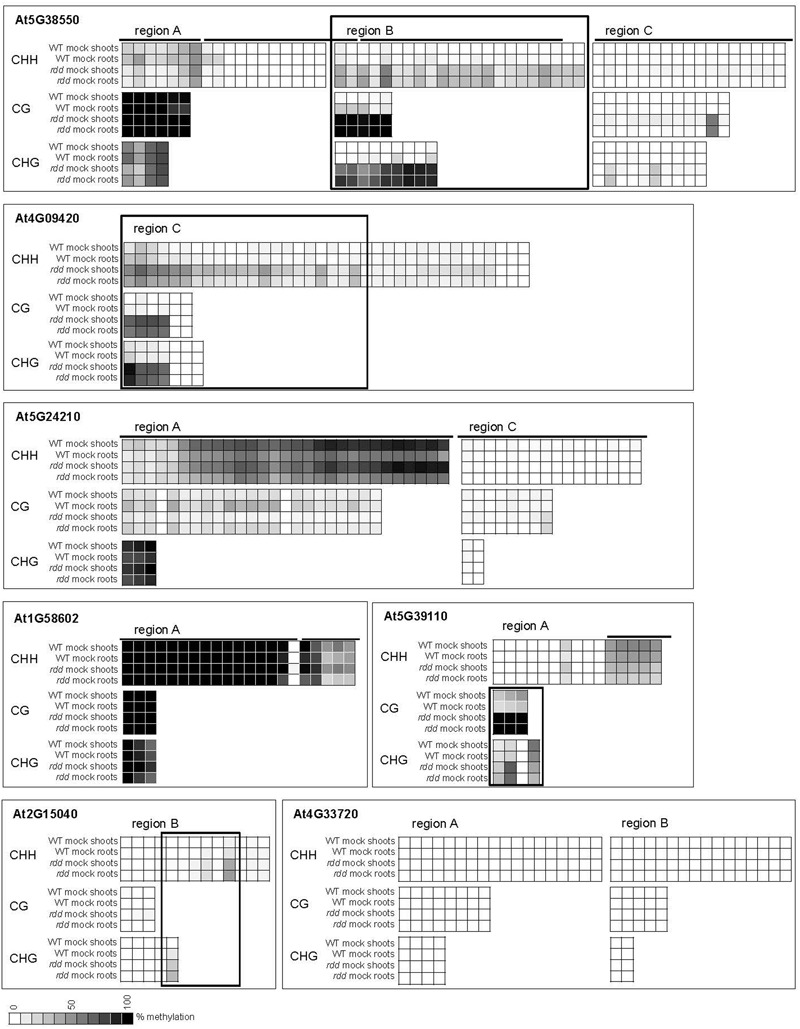
FIGURE 4.

DNA methylation levels of defense-related gene promoters. Plants were infected with Fusarium or mock treated and samples harvested at 3 dpi. Methylation percentage was calculated using Mutation Surveyor and the mean methylation level for each site is represented as a heatmap. Each square represents a single cytosine and lines above graphs show location of TE elements. Boxes indicate regions where the majority of cytosines showed significant differential methylation (p ≤ 0.05) between rdd and WT. The TSS for each gene is located to the right of the sequences shown here (see Figure 3). Extended regions of non-differential methylation have been removed for easier visualization. Fusarium infection data were largely similar and are not shown for easier visualization. For the complete dataset including Student’s t-test p-values see Extended Data File 1.
