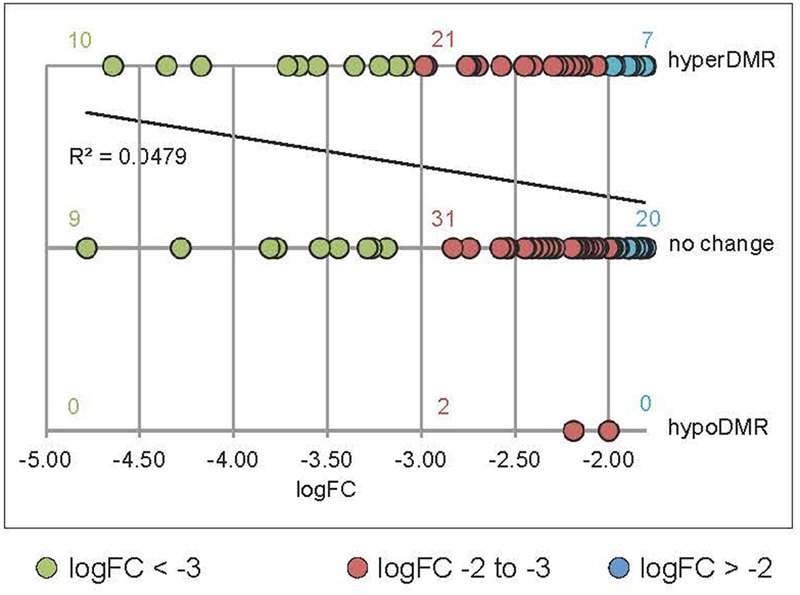
FIGURE 5.

Positive correlation between the level of downregulation in rdd and hypermethylation within 1 kb of the genes TSS’s. Data were obtained by interrogating a publicly available database (Stroud et al., 2013) for rdd and WT DNA methylation levels. rdd-downregulated protein coding genes (Le et al., 2014) were analyzed (downregulation logFC between –4.78 and –1.8). Transposable element (TE) genes were eliminated from this analysis. For multiple splice variants, only the most downregulated variant was included. The number of gene promoters with hyper-, hypomethylation (hyperDMR, hypoDMR) and no change in rdd compared to WT were plotted against the level of downregulation (logFC). Linear regression of all data shows a positive correlation between the level of downregulation and hyperDMR.
