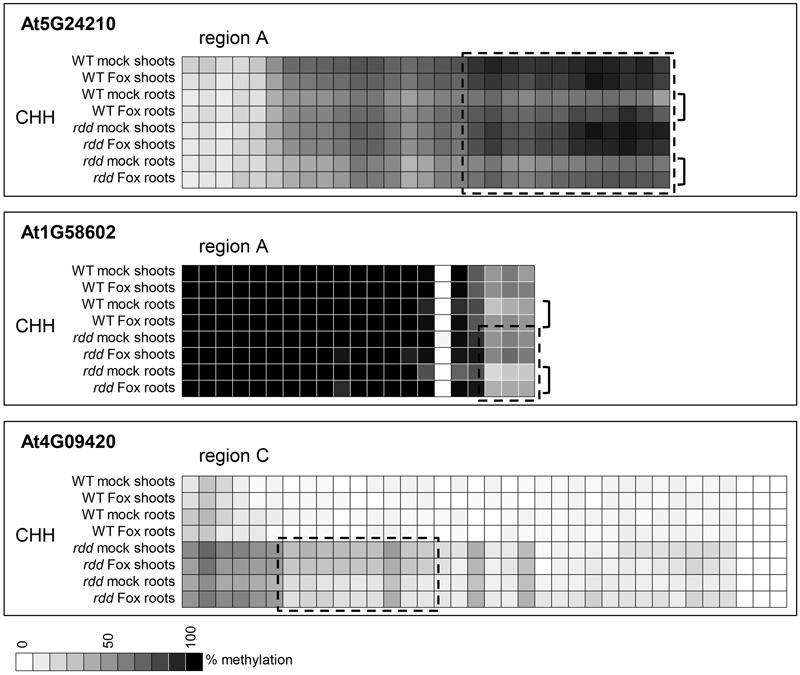
FIGURE 6.

Tissue specific differences in CHH methylation in defense-related gene promoters occur in a distinct localized manner. Data are identical to Figure 4 but selected regions of CHH methylation are shown for all datasets. The order in which the data are represented varies to Figure 4 to highlight the differences. Boxes highlight regions where the majority of cytosines show significant hypermethylation (p ≤ 0.05) in shoots compared to roots. Brackets highlight regions where Fusarium infection increased CHH methylation in roots compared to shoots (p ≤ 0.1). Student’s t-test p-values can be found in the Extended Data File 1.
