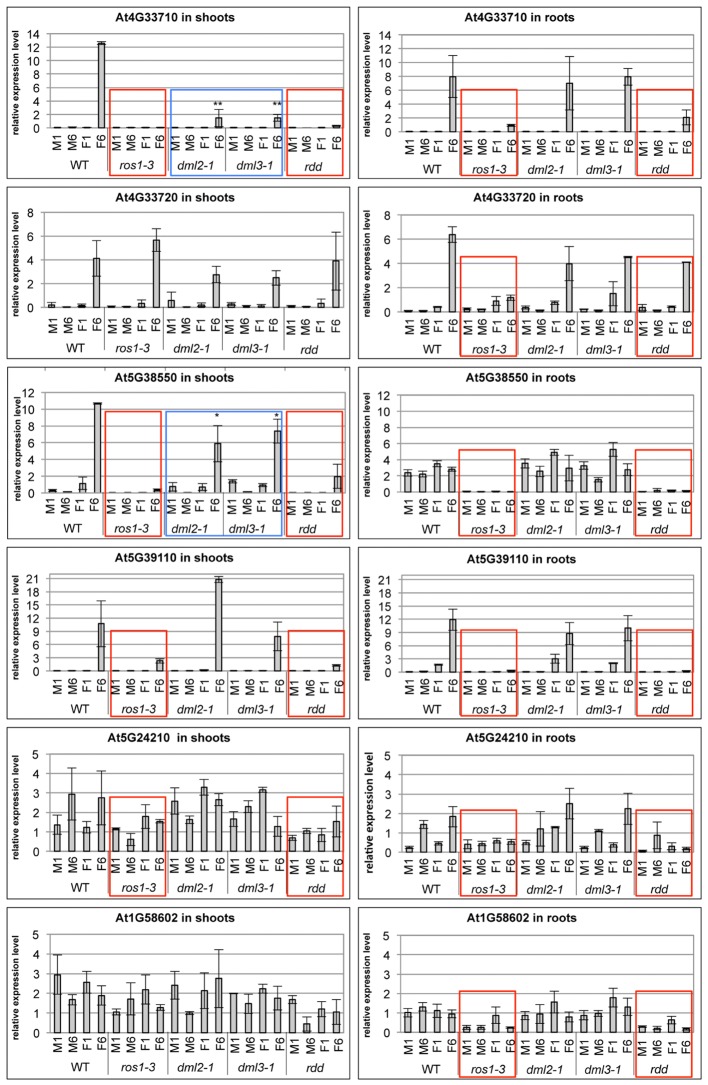
FIGURE 7.
The ros1-3 mutant shows a similar gene expression profile of defense-related genes as the rdd mutant. Plants were Fusarium infected (F) or mock treated (M) and the expression level in shoots (left panels) and roots (right panels) examined at 1 and 6 dpi. Expression levels of defense-related genes are shown relative to FDH; comparable results were obtained using actin2 as reference. Bars show the average of three independent biological replicates with error bars indicating standard deviation. Expression profiles that are similar between rdd and ros1-3 are indicated with red boxes, while expression profiles intermediate between WT and rdd in the dml2-1 and dml3-1 mutants are indicated by blue boxes. ∗p ≤ 0.1 and ∗∗p ≤ 0.05, according to Student’s t-test.

