FIGURE 2.
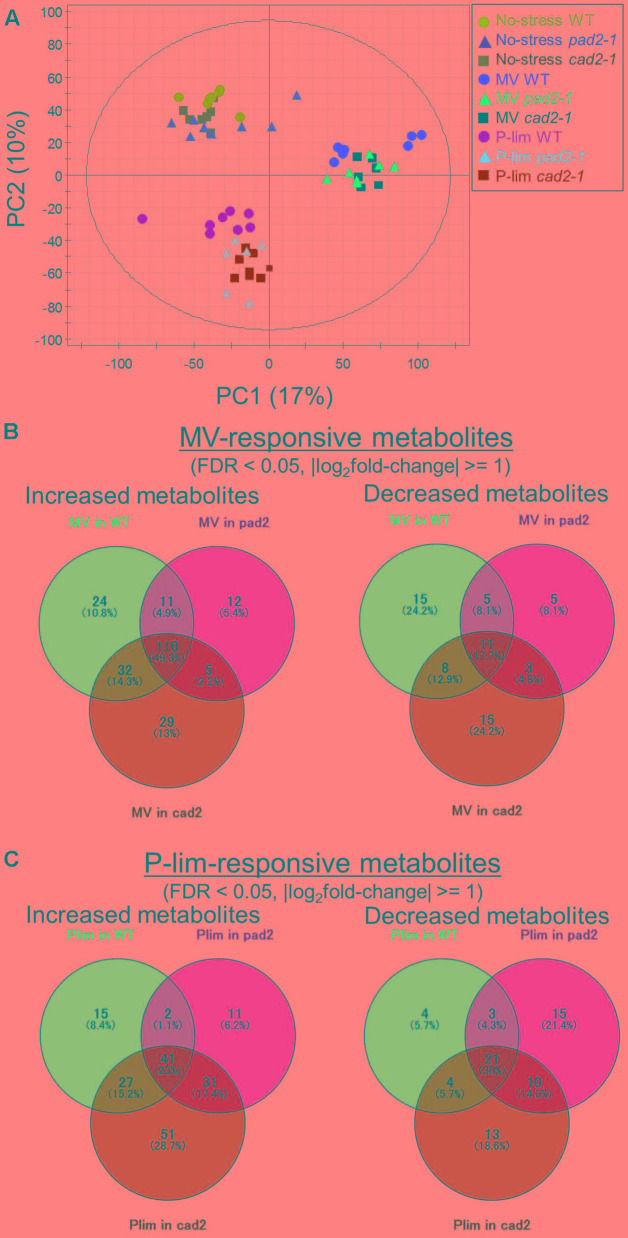
Summary of metabolite profiling conducted in this study. Principal component analysis (PCA) of the metabolite profiles of WT plants and mutants, cad2-1 and pad2-1, exposed to MV and P-lim treatment; integrated data obtained from multi-platform metabolite profiling were used (n = 8, biological replicates). The PCA score scatter plot shows that the samples were clustered according to the corresponding abiotic conditions as evidenced by the separation of PC1 (A). Venn diagram of MV- (B) and P-lim-responsive (known) metabolites (C). FDR, false discovery rate.

