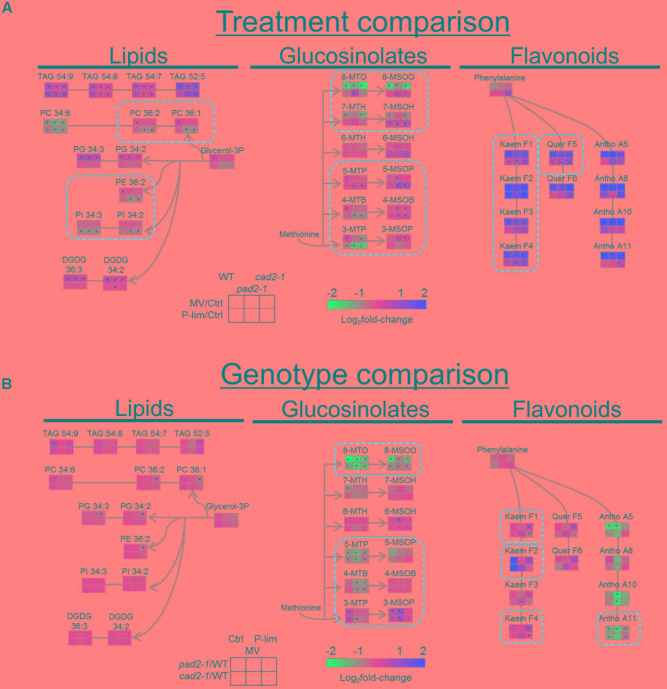
FIGURE 3.
Changes in metabolite levels associated with secondary metabolism in the GSH1 mutants and WT after MV and P-lim treatments. (A) Stress treatment comparison: Log2fold-change in metabolites exposed to the two abiotic stresses. The fold-change is represented by two directed colors; red and blue indicate increase and decrease, respectively, in the metabolite level elicited by MV treatment or P-lim. (B) Genotype-dependent comparison: Red and blue indicate increase and decrease, respectively, in the metabolite levels in the mutants vs. WT plants. For abbreviations of the metabolite names, see Supplementary Table S5. n = 8, biological replicates, ∗FDR < 0.05.

