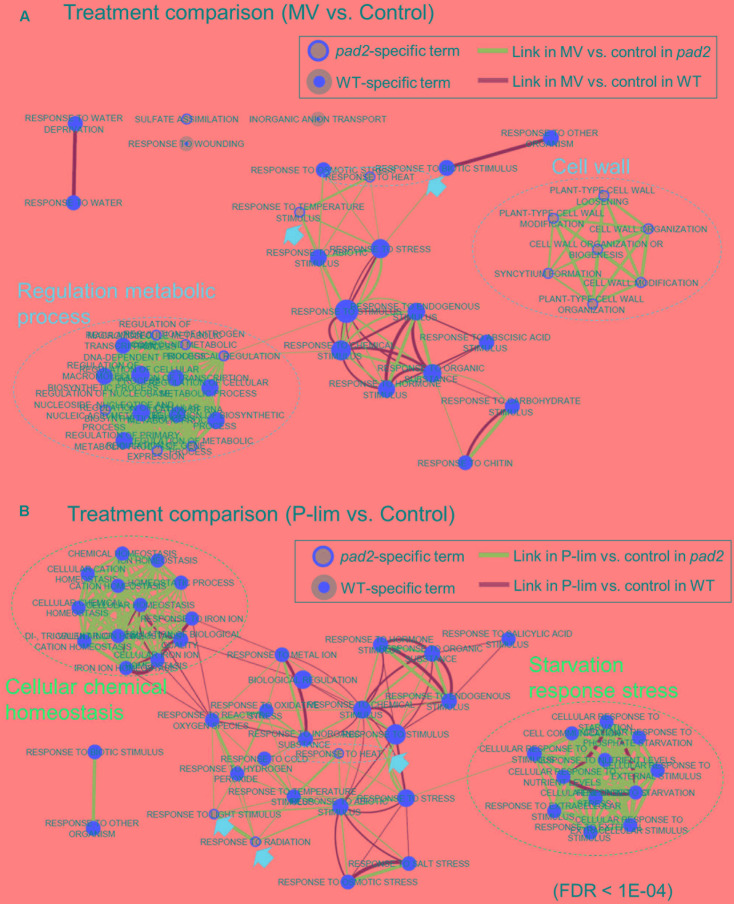
FIGURE 4.
Enrichment map showing biological processes between stress treatment and no-stress condition based on hypergeometric tests of gene ontology (GO) terms by using BiNGO software (Maere et al., 2005). The map shows the enriched GO terms in MV-treated vs. no-stress condition (A) and in P-lim vs. no-stress (B). Enrichment map can be used to compare differential transcriptomic responses to abiotic stress between 2 genotypes (i.e., pad2-1 vs. WT). Nodes represent GO terms, and links between nodes represent gene overlap between GO terms, resulting in a rapid identification of the major enriched functional categories. Inner circle size of each node represents the number of DEGs in “comparison 1” (e.g., MV vs. no-stress in WT) within the GO term in a biological process. Node border size represents the number of DEGs in “comparison 2” (e.g., MV vs. no-stress in pad2) within the GO term in a biological process. Color of the node and border indicate significance based on the BiNGO FDR of the GO term for “comparison 1” and “comparison 2,” respectively. The red-filled nodes highlight the major GO functional terms. Link size shows the number of DEGs that overlap between the two connected GO terms (Jaccard coefficient, the cut-off is 0.25). Green links correspond to both datasets when it is the only colored link. Green links indicate “comparison 1” and blue indicates “comparison 2.” Blue dotted circles represent summarized GO term clusters based on AutoAnnotate (Kucera et al., 2016). The maps were generated using Cytoscape (v3.2.1) Enrichment Map plugin (Merico et al., 2010; Isserlin et al., 2014).

