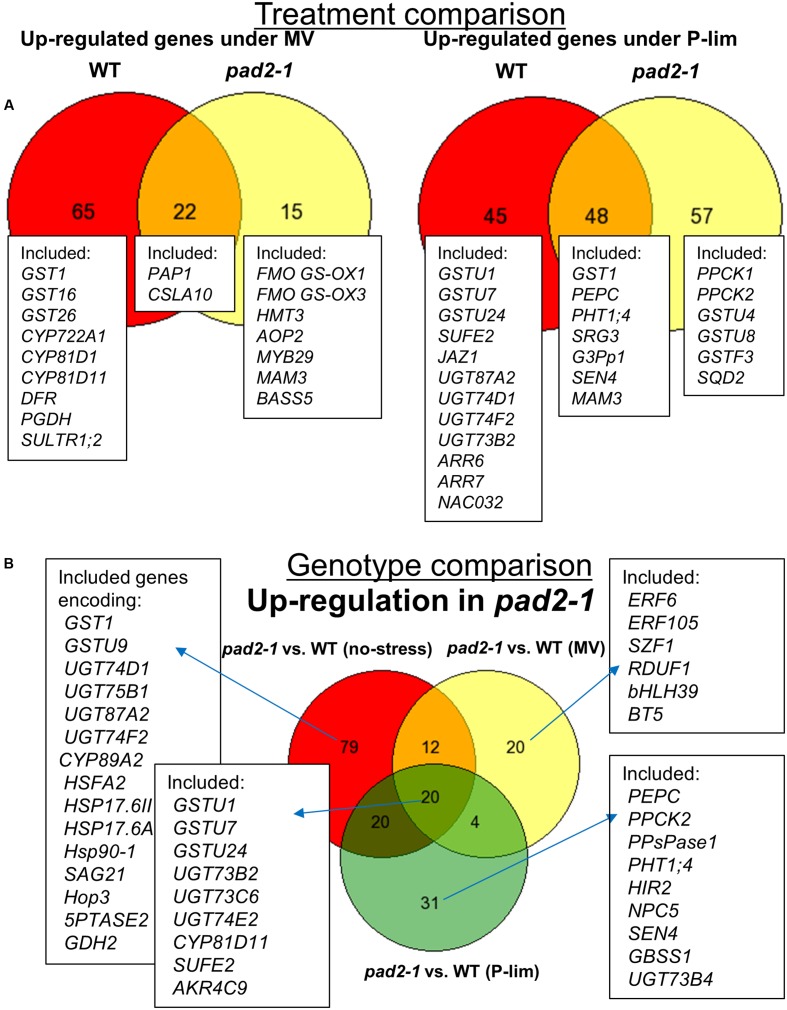
FIGURE 5.
Venn diagrams representing the classification of genes based on microarrays. (A) We identified 87 MV-inducible genes in WT plants and 37 MV-inducible genes in the pad2-1 mutant. We also identified 93 low-P-inducible and 105 low-P-inducible genes in WT plants and the pad2-1 mutant, respectively. (B) Genotype-dependent up-regulated genes. Under the control condition, MV-treatment, and low P stress condition, we identified 131, 56, and 75 up-regulated genes, respectively, in pad2-1. We used genevenn (http://genevenn.sourceforge.net/vennresults.php) to draw the diagrams. Differentially expressed genes were identified using a threshold |log2 fold-change| ≥ 1 and FDR < 0.05.

