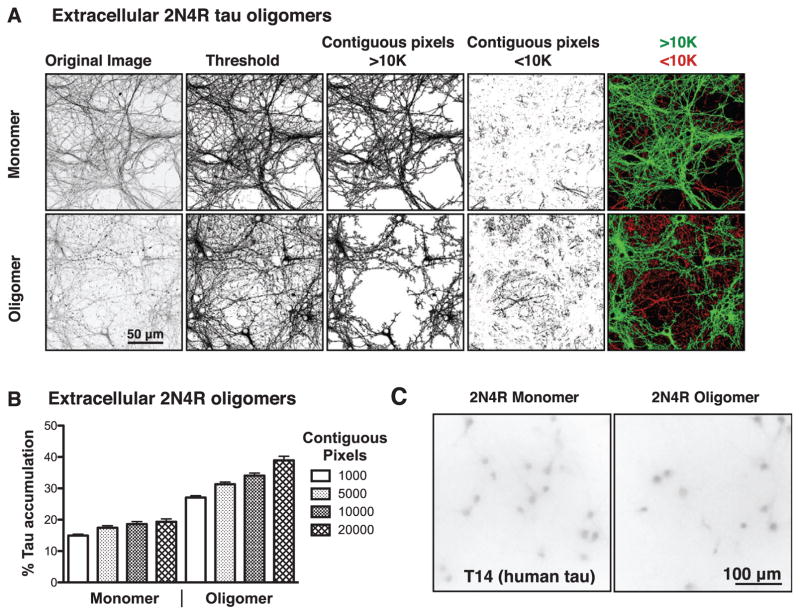
Fig. 2.
Image analysis of tau-treated neurons. A) Representative immunofluorescence images of primary neurons stained for total tau with Tau 5 after treatment with monomeric or oligomeric extracellular tau. Fluorescence micrographs were thresholded to indicate pixels above background intensity, segregated into groups of >10,000 or <10,000 contiguous pixels above the threshold intensity, then pseudo-colored green to indicate intact staining (>10,000 contiguous pixels) or red to indicate disrupted staining (<10,000 contiguous pixels). B) Test of various pixel size cutoffs in monomer or oligomer treated neurons. 10,000 contiguous pixels was chosen as the cutoff between intact and disrupted tau for all subsequent assays. C) Monomer and oligomer treated cells probed with antibodies for human tau (T14) exhibit only background staining.

