Fig. 1.

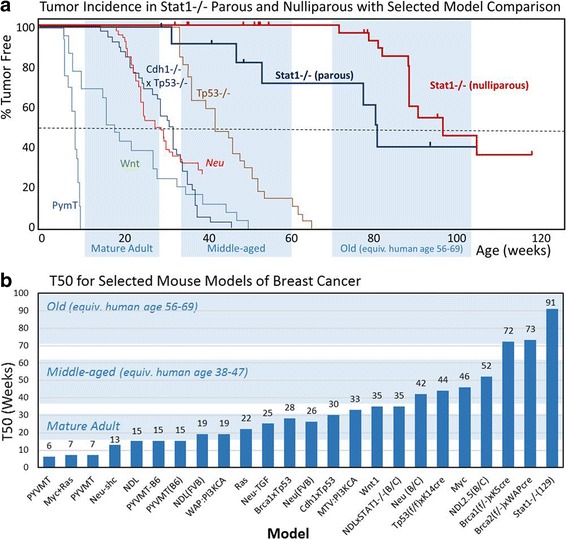
Kaplan-Meier and T 50 plots comparing tumorigenesis in 129:Stat1 −/− and other published models. a Kaplan-Meier plots showing survival curves for parous and nulliparous 129:Stat1 −/− as compared with those from the Wnt, Neu, PyVMT, Tp53 −/−, and Cdh1 −/−/Tp53 −/− models. The blue highlighting indicates the ages in weeks when mice are considered mature, middle-aged, and old adults as calculated by Harrison’s laboratory [44]. b Chart of the T 50 values for 129:Stat1 −/− and a variety of common mouse models of human breast cancer. Where the T 50 was not provided, the median value was used as the T 50. The blue highlighting indicates the ages in weeks during which mice are considered mature, middle-aged, and old adults [44]
