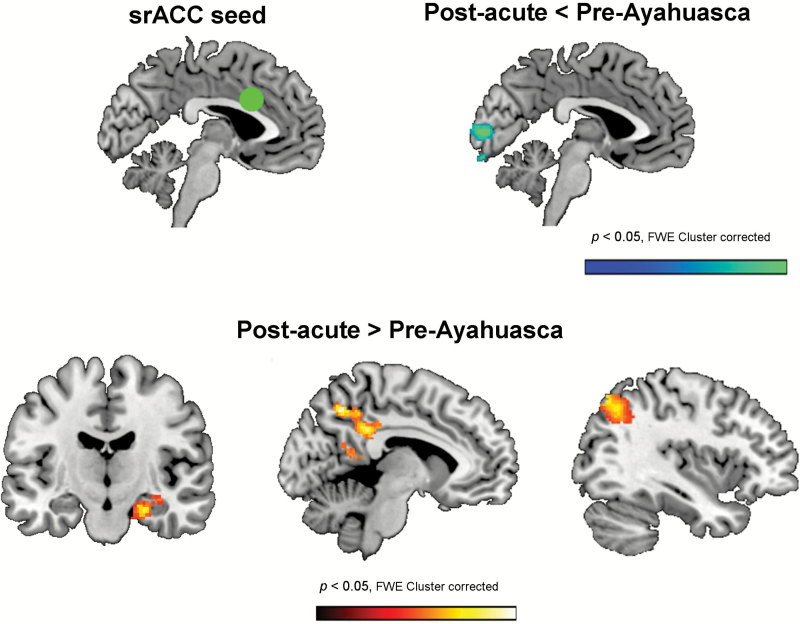
Figure 4.
Statistical maps showing the results of the second-level analysis (post- vs. pre-intake) of changes in connectivity between the superior rostral anterior cingulate (srACC) seed (green circle) at MNI coordinates x = 0, y = 15, z = 30, and the rest of the brain. As shown in the top panel, decreases in connectivity (cold colors) were found with voxels located in the cuneus (visual cortex: BA 18 and 19). Increases in connectivity were found with 3 separate clusters (bottom panel): (a) the right medial temporal lobe (left brain map); (b) the precuneus and posterior cingulate cortex (center brain map); and (c) the left angular gyrus and left parietal lobule (right brain map). Results are shown corrected for multiple comparisons at the cluster level (FWE < 0.05, z > 2.5, 20 contiguous voxels).

