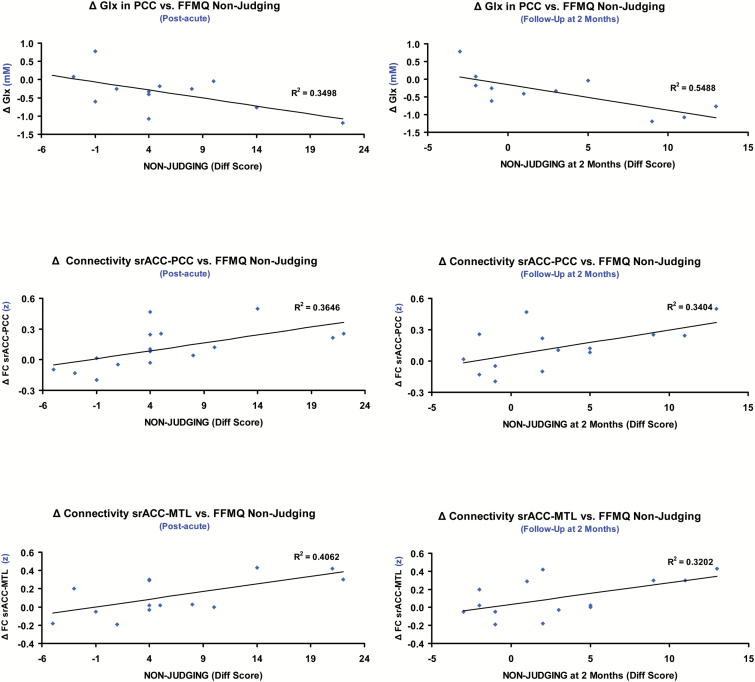
Figure 6.
Scatter plots showing significant correlations between difference scores at the post-acute and follow-up assessments (relative to baseline values) for the FFMQ nonjudging subscale and changes in neuroimaging measures (post-acute minus pre-intake). The top panels show the correlations with changes (Δ) in Glx (glutamate+glutamine) concentrations (millimolar) in the posterior cingulate cortex (PCC) voxel as measured using MRS. The middle panels show the correlations with changes in functional connectivity (Δ in z values) between the superior rostral anterior cingulate (srACC) seed and the precuneus/PCC cluster. The lower panels show the correlations with changes in functional connectivity (Δ in z values) between the srACC seed and the right medial temporal lobe (MTL) cluster. The left column shows correlations with FFMQ nonjudging difference scores in the post-acute assessment and the right column shows correlations with difference scores at follow-up. R and P values are reported in the main text.

