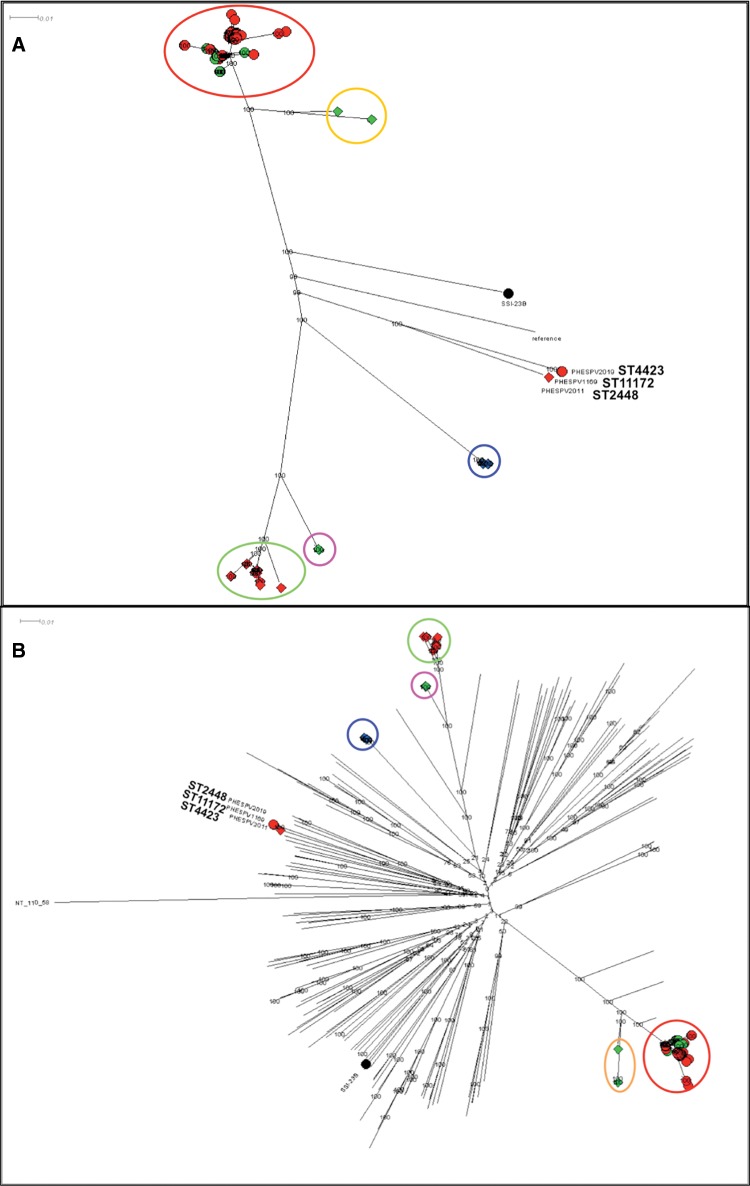
Fig. 5.
—Phylogenetic analysis of 23B and 23B1 isolates. Maximum likelihood (ML) trees generated following SNP analyses using RAxML with the complete genome of Streptococcus pneumoniae 23F ATCC700699 strain as reference for (A) and the nonencapsulated S. pneumoniae R6 strain for (B). The percentage of replicate trees in which the associated taxa clustered together in the bootstrap test (1,000 replicates) is shown next to the branches. The scale bar corresponds to the number of nucleotide substitutions per site. All positions with <90% site coverage were eliminated. That is, <10% alignment gaps, missing data, and ambiguous bases were allowed at any position. (A) Radial phylogram representation of ML tree for the full 23B and 23B1 data set (n = 161). A total of 18,730 variant positions were included in the analysis. Lineages 23B and 23B1 are represented with shapes, circle, and diamond, respectively, whereas the shape color is used to differentiate the country of origin for each isolates (UK: red, Thailand: blue, USA: green). The various clusters are circled and colored based on lineage, country and/or MLST clonal complex (CC); 23B CC439: red, 23B1 CC1349: green, CC6707: blue, ST1373: pink, CC36: orange. Zoomed in views of the two main branches can be seen in supplementary figure S3, Supplementary Material online. (B) Radial phylogram representation of ML tree for the full 23B and 23B1 data set (n = 161) plus reference strains for all serotypes (n = 92) and representative clinical isolates (n = 76). A total of 87,965 variant positions were included in the analysis. The lineages and country of origin representation remains the same as (A). The various clusters are circled and colored based on lineage, country and/or MLST CC as described in (A). This figure is available in Microreact (https://microreact.org/project/rJpKzoXTe; last accessed August 21, 2017).

