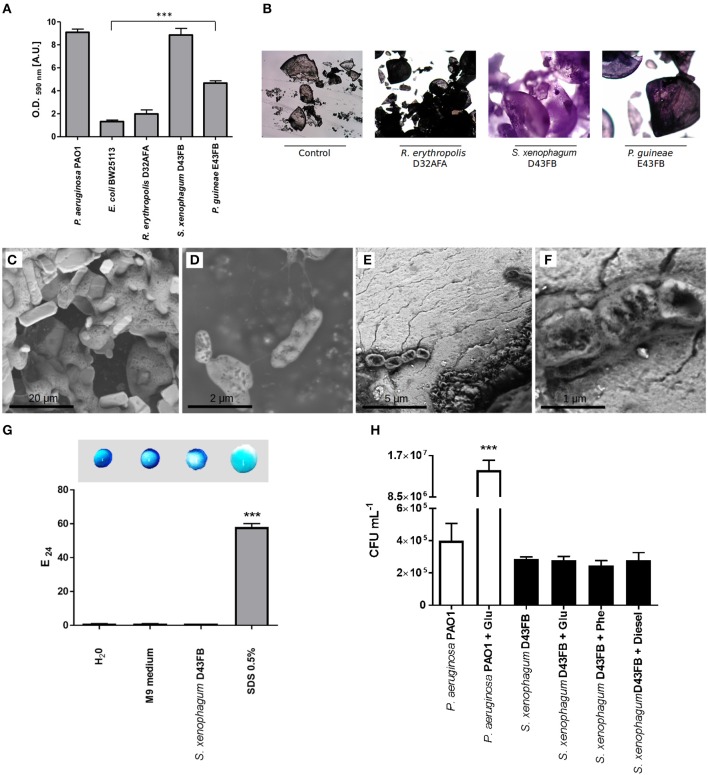
Figure 3.
Biofilm production, biosurfactant and chemotactic responses of phenanthrene degrading isolates. (A) Biofilm production on polystyrene microtiter plates. Adhered biomass was quantified by crystal violet staining. P. aeruginosa PAO1 and E. coli BW25113 were used as controls. Values of Antarctic strains were compared to E. coli to establish statistical differences. (B) Adhesion of bacteria to phenanthrene crystals. Crystals were incubated with degrading strains, washed, stained with crystal violet and examined by light microscopy. (C–F) The interaction between strain D43FB and phenanthrene was studied by scanning electron microscopy. (C) Phenanthrene crystals. (D) S. xenophagum D43FB grown with glucose as sole carbon source. (D,E) S. xenophagum D43FB grown with phenanthrene as sole carbon source. (F) Biosurfactant production was assessed by droplet collapse (top) and E24 index (bottom), using spent media from S. xenophagum D43FB growth. Water and M9 media were used as negative controls, and 0.5% SDS used as positive control. (G) Chemotaxis by P. aeruginosa PAO1 and S. xenophagum D43FB toward different compounds was assessed using a modified capillary assay. (H) Number of bacterial cells that were attracted toward glucose, phenanthrene, and diesel-fuel were assessed after incubation, and compared toward buffer only control condition. *** = Statistical significance with p < 0.001.

