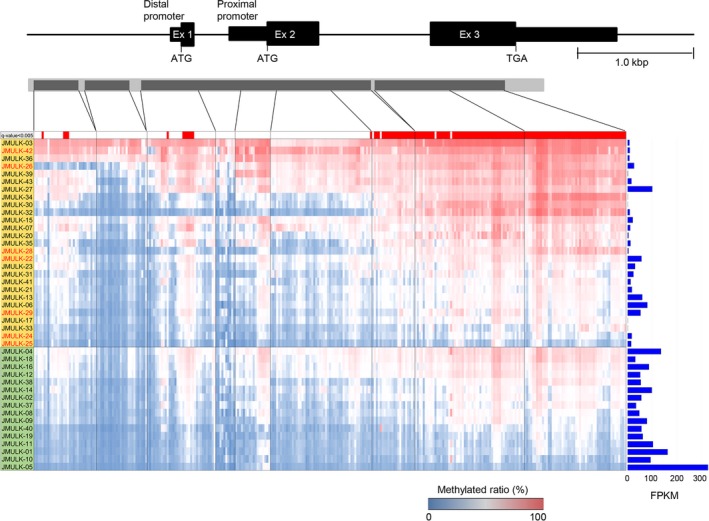
Figure 6.

Methylation status of NKX2‐1/TTF‐1. The presence or absence of methylated cytosine was confirmed for CpG islands in almost the entire region of NK2 homeobox 1 (NKX2‐1)/thyroid transcription factor 1 (TTF‐1) including upstream of the 5′‐translated region. There are two isoforms in NKX2‐1/TTF‐1: a major form that is encoded by mRNA harboring exons 2 and 3, and a minor isoform encoded by all exons. There are proximal and distal promoters. In this heat map, the horizontal axis shows cytosine, which may be methylated among PCR‐amplified regions (dark gray bar regions within light gray bar). The region at which cytosine was converted to uracil by a bisulfite treatment is indicated by blue, and the region not converted is indicated by red. The methylation site is indicated by red, unmethylated cytosine by blue, and the methylated ratio is by a blue–red color bar in the lower panel. In NKX2‐1/TTF‐1 immunostaining negative cases (orange column) and positive cases (green column), the sums of the methylation ratio of cytosine that may be methylated at 303 sites in each sample were calculated and arranged in descending order of their values. The expression level of NKX2‐1/TTF‐1 is shown as the FPKM value calculated from RNA analysis data on the right side of the heat map. In the sample column, seven NKX2‐1/TTF‐1 mutation‐positive cases are indicated using red letters. Methylation regions where there are differences between positive and negative groups for NKX2‐1/TTF‐1 immunostaining are red‐coded in the upper part of the heat map (q value <0.005).
