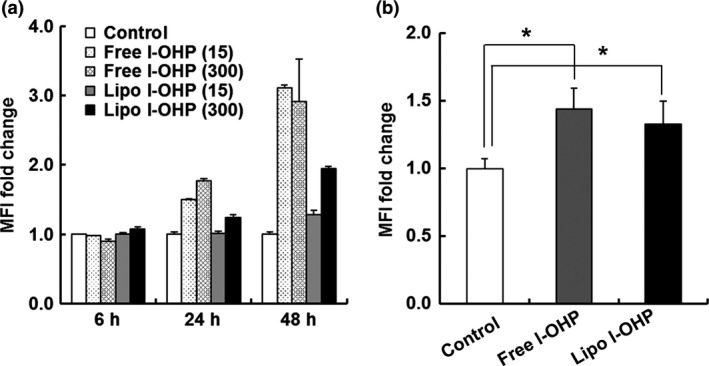
Figure 5.

l‐OHP formulations increased the MHC‐1 level of tumor cells. (a) C26 cells were cultured for 6, 24 and 48 h in the presence of Free l‐OHP or Liposomal l‐OHP (15, 300 μM). (b) On days 0 and 7, C26 tumor‐bearing BALB/c mice received two intravenous injections of either Free l‐OHP or Liposomal l‐OHP. Non‐treated mice served as the control. On day 10, tumors were collected. The treated cells in vitro and in vivo were stained with anti‐mouse MHC‐1 (H‐2Dd) antibody and then analyzed using flow cytometry. Each value represents the mean ± SD (n = 3). *P < 0.05. [Correction added on 31 July 2017, after first online publication: In the figure legend of figure 5, the incubation times in the sentence “C26 cells were cultured for 6, 12 and 48 h in the presence of Free l‐OHP or Liposomal l‐OHP (15, 300 μM)” has been changed to “6, 24 and 48h”.]
