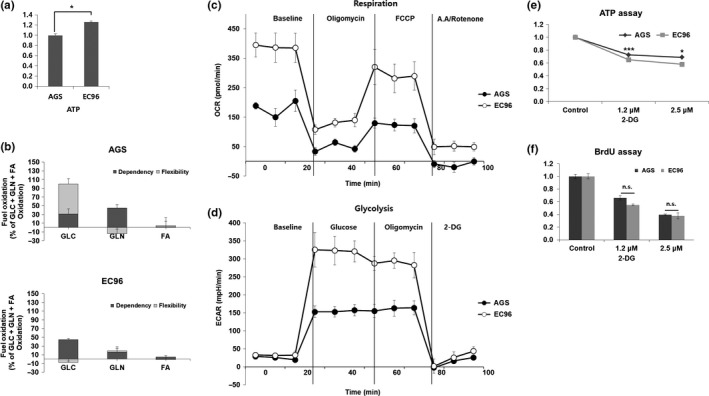
Figure 3.

E‐cadherin expression enhances mitochondrial oxidative phosphorylation and glycolysis. (a,b) Gastric cancer cells were subjected to cellular ATP measurement (a) and fuel flex measurement (b). Fuel flex responses to 2 μM UK5099 (glucose oxidation pathway inhibitor), 4 μM etomoxir (fatty acid oxidation inhibitor), and 3 μM is‐2‐(5‐phenylacetamido‐1,3,4‐thiadiazol‐2‐yl)ethyl sulfideChange to Bis‐2‐(5‐phenylacetamido‐1,3,4‐thiadiazol‐2‐yl)ethyl sulfide (BPTES, glutamine oxidation pathway inhibitor) were measured. (c) Cells were plated in XF24 culture plates for 24 h using medium containing glucose, glutamine, and pyruvate. Oxygen consumption rate responses to oligomycin (2 μM), Carbonyl cyanide 4‐(trifluoromethoxy)phenylhydrazoneChange to Carbonyl cyanide 4‐(trifluoromethoxy)phenylhydrazone (FCCP, 0.1 μM), antimycin A (1 μM), and rotenone (1 μM) were measured. (d) Cells were plated in XF24 culture plates using nutrient‐free base medium. (e,f) Cells were subjected to cellular ATP measurement (e) and BrdU incorporation (f) by treatment with 2‐deoxyglucose (2‐DG; 0.1 μM) for 24 h. *P < 0.05; ***P < 0.001. n.s., not significant.
