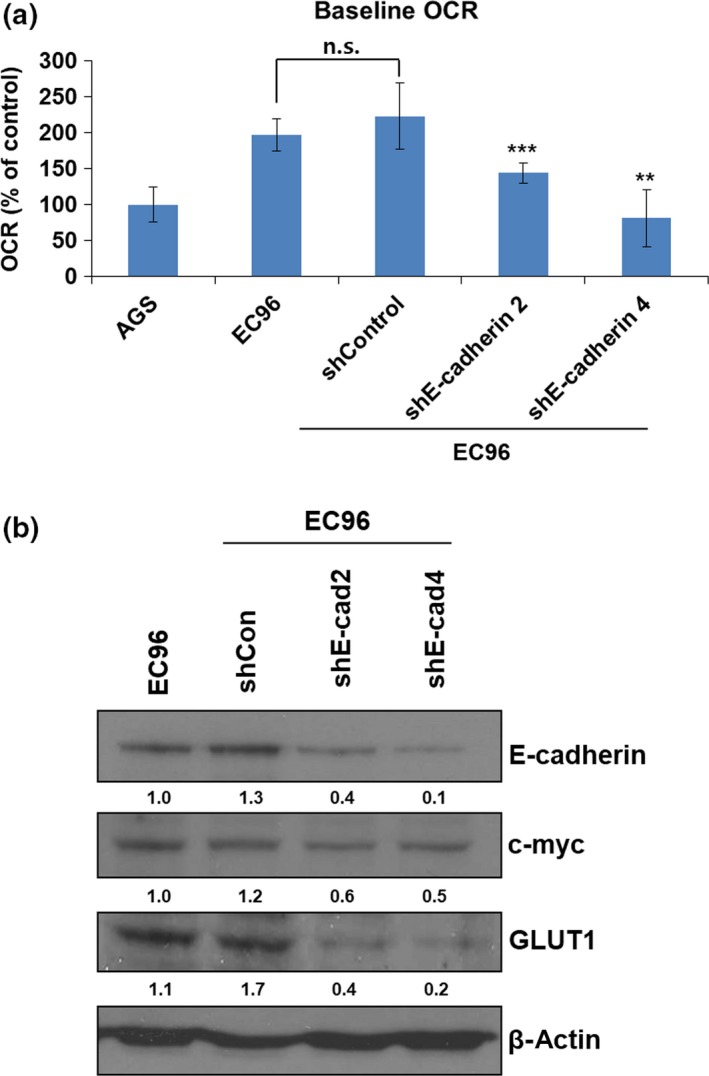
Figure 6.

E‐cadherin knockdown reduces mitochondrial oxidative phosphorylation and glucose transporter 1 (GLUT1) expression in EC96 gastric cancer cells. (a) EC96‐, and shE‐cadherin transfected EC96 cells were seeded at 20 000 cells/well in XF24 culture plates for 24 h. The oxygen consumption rate (OCR) response to assay medium including glucose, glutamine, and sodium pyruvate. **P < 0.01; ***P < 0.001. n.s., not significant. (b) EC96‐ and sh‐Control and E‐cadherin‐knockdown EC96 cell lysates were subjected to immunoblot analysis for E‐cadherin, c‐myc, GLUT1, and β‐actin. Band intensity was normalized to β‐actin.
