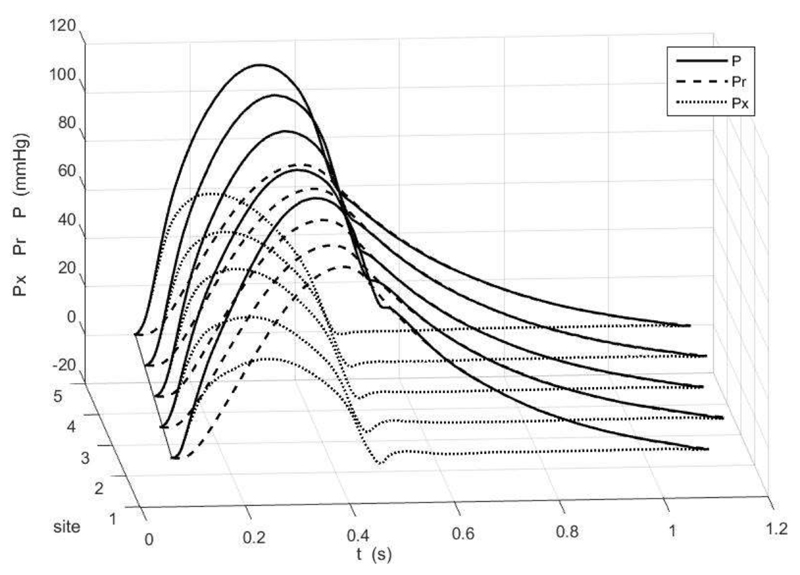
Figure 1.
The ensemble average of the measured pressure waveform at the 5 aortic sites for one patient (black) together with the reservoir (dashed) and excess (dotted) pressure waveforms. Time is relative to the R-wave of the simultaneously measured ECG. The dotted black line indicates the time of the diastolic point at the different sites, the slope of this line is the pulse wave speed. For ease of comparison of the waveforms, P-Pd and Pr-Pd are plotted.

