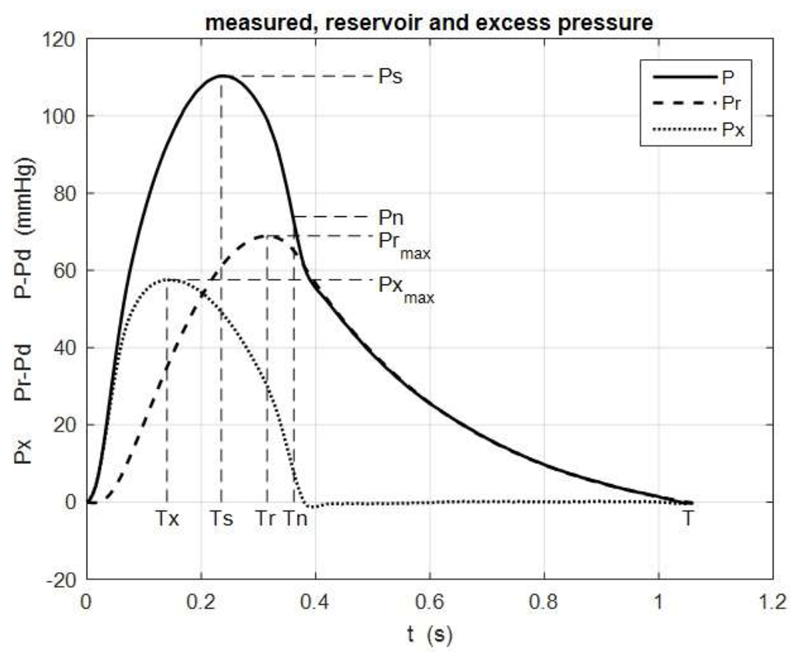
Figure 2.
A typical example of the ensemble average pressure P (solid line) together with the reservoir pressure Pr (dashed line) and excess pressure Px (dotted line). This example is from the aortic bifurcation (site 5). Also shown are the maxima Ps, Prmax and Pxmax and times of the maxima, Ts, Tr and Tx respectively. Tn is the time of minimum dP/dt after Ts which is taken as the end of systole and Pn is the pressure at that time.

