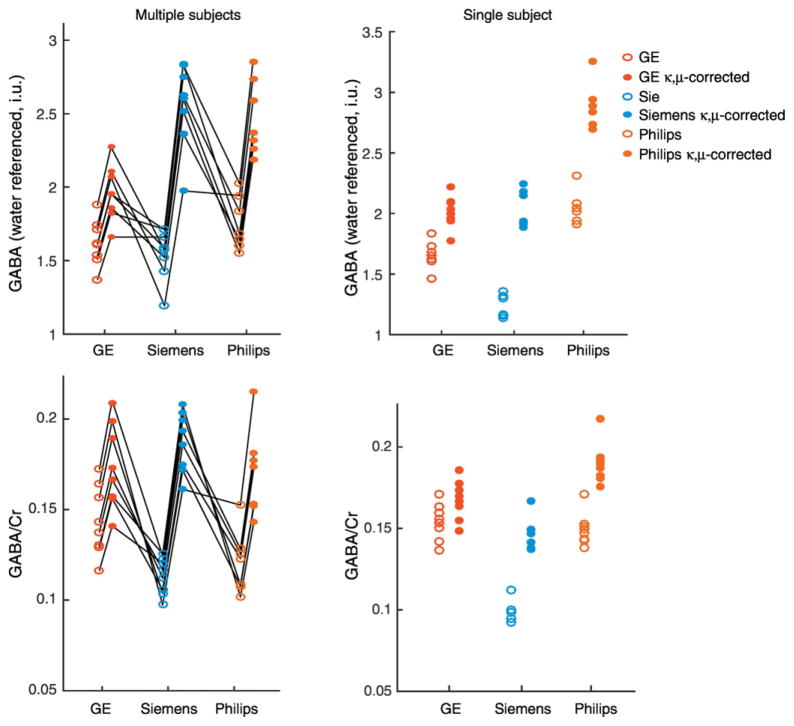
Fig. 6.
In vivo GABA measures on each scanner. GABA was quantified relative to the water signal and the Cr peak. Uncorrected GABA values are shown in open circles and κ,μ-corrected values are shown in closed circles. On the left, the multiple subjects (individuals connected by black lines) and on the right, a single subject scanned multiple times on each scanner.

