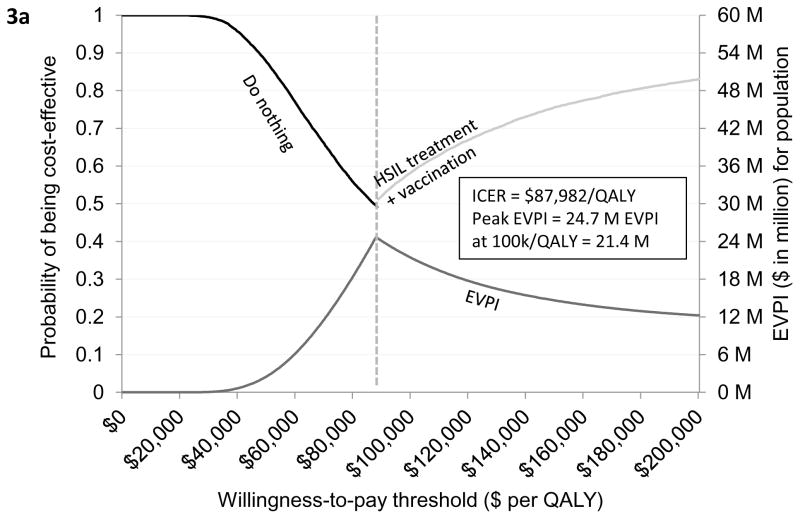
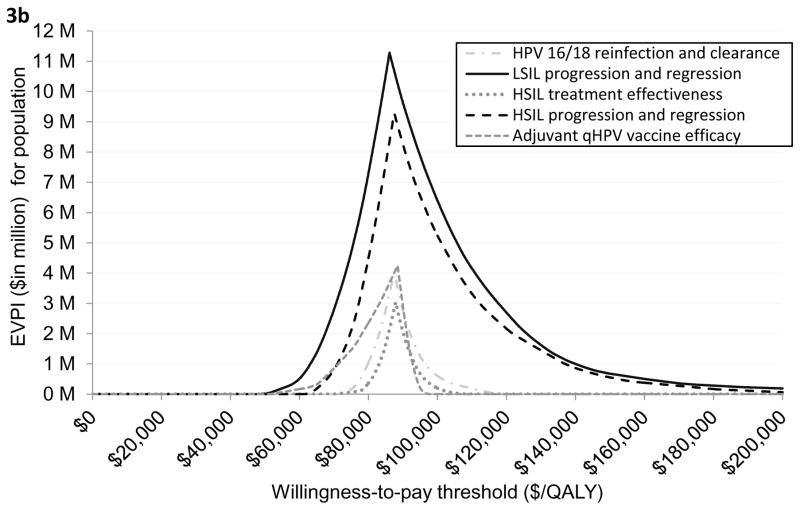
Figure 3. Cost-effectiveness acceptability frontier and expected value of perfect information assuming worst-case adjuvant qHPV vaccination efficacy.
Figure 3a provides a graphical illustration of the uncertainty associated with the optimal strategy over a range of values for the willingness-to-pay thresholds under the assumption of worst-case adjuvant qHPV vaccination efficacy. As seen in the figure, do nothing was the optimal strategy if the willingness-to-pay (WTP) threshold was below $87,982 per QALY. If the WTP threshold was greater than $87,982 per QALY then HSIL treatment plus adjuvant vaccination was the optimal strategy. The secondary vertical axis of the figure illustrates the EVPI associated with HSIL management in HIV-infected MSM when worst-case adjuvant qHPV vaccination efficacy was assumed. As seen in the figure, the value of further investigation was $21 million at the WTP threshold of $100,000 per QALY. Figure 3b shows EVPPI associated among HIV-infected MSM. Solid black, dashed gray, dashed brown, dashed and dotted blue, and dotted green lines represent the parameters LSIL progression and regression, HSIL progression and regression, adjuvant qHPV vaccination efficacy, HPV 16/18 reinfection and clearance, and HSIL treatment effectiveness, respectively. As seen in the figure, at the WTP threshold of $100,000 per QALY, the EVPPIs for LSIL progression and regression and HSIL progression and regression were $6 million and $5 million, respectively.
Abbreviations: EVPI, expected value of perfect information; EVPPI, expected value of partial perfect information; ICER, incremental cost-effectiveness ratio; HSIL, high-grade squamous intraepithelial lesions; QALY, quality-adjusted life-year


