
Figure 4. Prmt1 regulates global translation initiation.
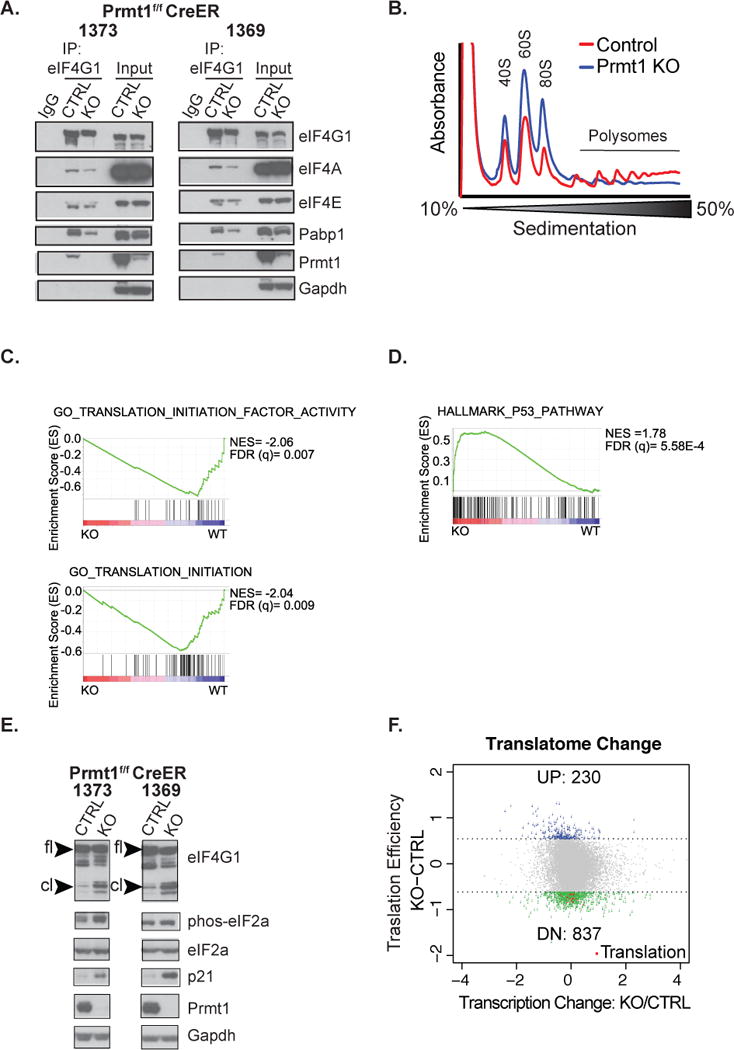
(A) Assessment of eIF4G1 interaction with other members of the translation initiation complex and Prmt1 by immunoprecipitation in two independent vehicle-treated control and 4OHT-treated Prmt1f/f CreER mOS cells (1373 & 1369). (B) Polysome analysis of RNAs isolated from control (Red) and Prmt1f/f CreER mOS treated with 4OHT (Blue). The positions of free ribosomal subunits (40S, 60S) monosomes (80S), and polysomes are indicated. Representative trace of one out of three biological replicates is shown. (C & D) GSEA analysis of the pre-ranked list of differentially expressed genes in the Prmt1f/f CreER mOS control as compared to the conditional knockout. Normalized enrichment score (NES) and False discovery rate FDR are both indicated. (E) Western blot analysis of indicated proteins in vehicle treated control and 4OHT-treated Prmt1f/f CreER mOS cells. “fl” indicates full-length protein, whereas “cl” denotes cleaved protein. (F) Analysis of mRNA abundance associated with the “heavy” polysome relative to the “light” polysome following Prmt1 depletion in Prmt1f/f CreER mOS. The translation efficiency (Y axis) is defined as the difference between the Log2 ratios of the “heavy” to “light” in the conditional KO versus the control. X-axis denotes Log2 fold change of genes affected at the transcriptional level in the conditional knockout (KO) as compared to the control (CTRL). Blue and green dots designate transcripts that are up regulated or down regulated at the translation level, respectively. Red dots highlight down regulated transcripts associated with translation GO processes.