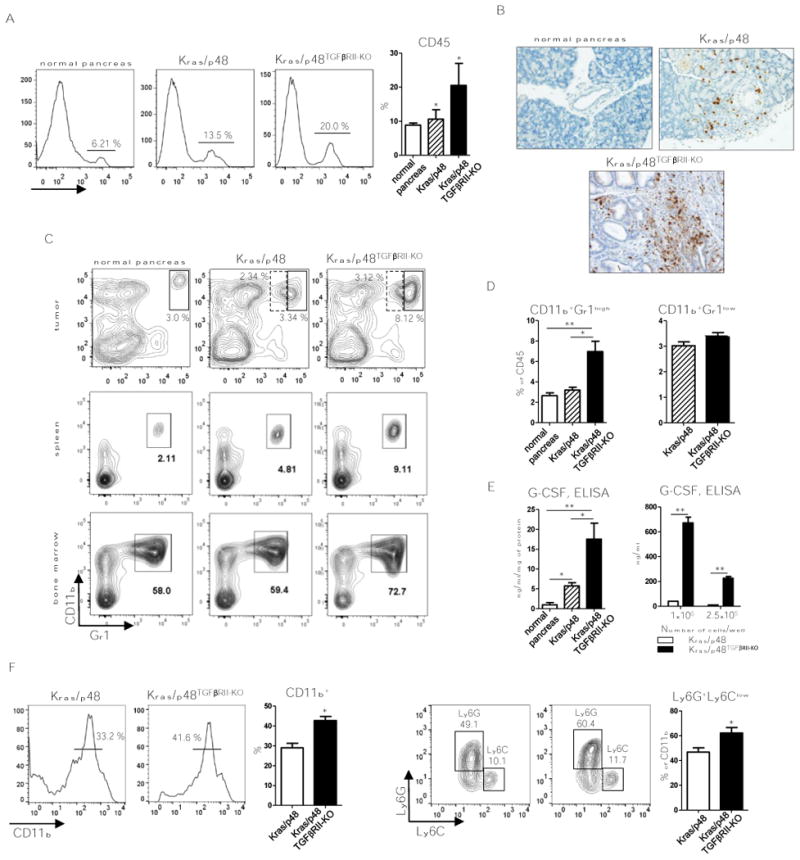
Figure 1. Expansion of Ly6G+ cells in aggressive PDAC.

A, Flow cytometry analysis of CD45+ cells in normal, Kras/p48, and KRas/p48TGFβRII-KO tissue and percent to DAPI- live cells quantification. Plots are gated as DAPI-. 10 mice per group were analyzed.* P < 0.05. B, IHC for Gr1 (RB6-8C5) of normal pancreas, pancreas isolated from Kras/p48 mice and Kras/p48TGFβRII-KO mice at 5-6 weeks of age. C, representative flow cytometry plots of CD11b+Gr1+ cells in pancreatic tissue, spleen and bone marrow from normal, Kras/p48, and KRas/p48TGFβRII-KO mice. Plots are gated as CD45+DAPI-. 10 mice per group were analyzed. D, quantitative data of Gr1-high (solid line) and Gr1-low (dotted line) cells in tumor tissue showed on panel C, top. * P < 0.05, ** P < 0.01. 10 mice per group were analyzed. E, ELISA data of G-CSF levels in pancreatic tissue (left) and basal secretion in cultured cell lines (right). Data corresponds to the mean ± SEM of three individual mice from two experiments. Pancreatic cell lines from Kras/p48 mice and Kras/p48TGFβRII-KO mice were cultured in 6 wells plate in 3 ml of DMEM/10% FBS for 24 hr and level of G-CSF was measured in conditioned media. n = 3. * P < 0.05, ** P < 0.01. F, flow cytometry analysis of CD11b+ cells and Ly6G vs. Ly6C cells (gated as CD11b+) after differentiation of bone marrow progenitors (Lin- cells) for 5 days in presence of 25% conditioned media from Kras/p48 and Kras/p48TGFβRII-KO pancreatic carcinoma cell lines. Data correspond to the mean ± SEM of three individual mice from two experiments. * P < 0.05.
