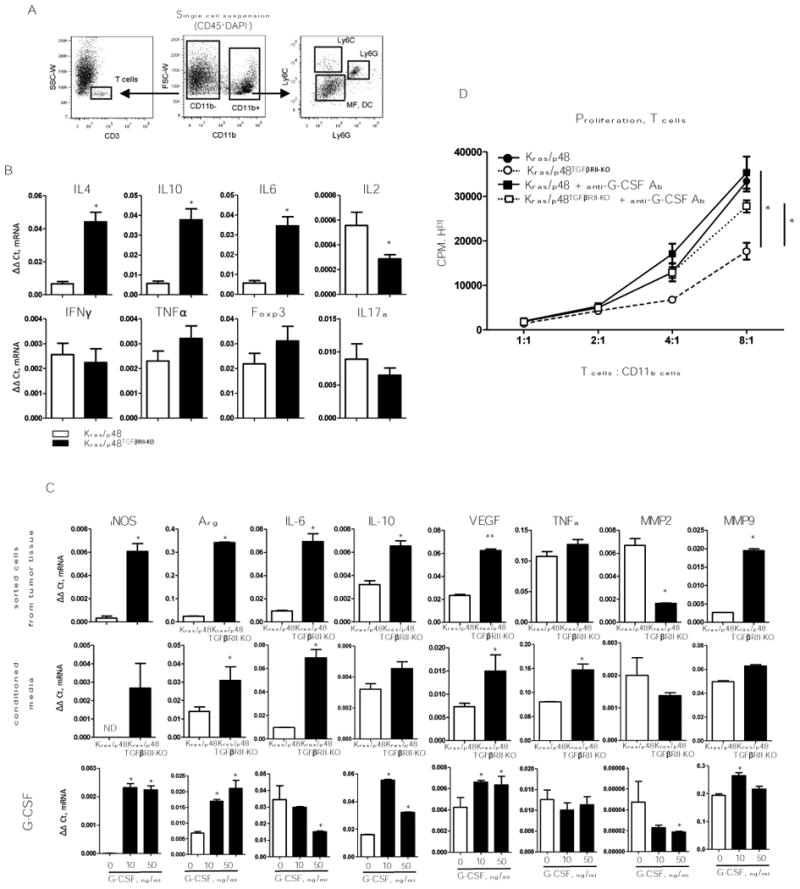
Figure 2. Functions of myeloid cells.

A, Cell sorting strategy. B, T-cell (CD3+) gene expression profile. Cells were sorted as shown in (A), top row: gene expression for Th2 cytokines presented as ΔΔCt normalized to Gapdh. Bottom row: gene expression for Th1 cytokines presented as ΔΔCt normalized to Gapdh. Data correspond to the mean ± SEM of three individual mice from two experiments. * P < 0.01. C, Gene expression analysis of pro-tumorigenic cytokines previously identified as cytokine mediators of MDSC immune suppression. top row: Gene expression measured by qPCR on sorted Ly6G; middle row: Gene expression analysis of Gr1+ cells, from the spleen of 4T1 tumor bearing mice, treated with conditioned media from Kras/p48 (open bars) or from Kras/p48TGFβRII-KO (closed bars) carcinoma cells. bottom row: Gene expression analysis of Gr1+ cells, from the spleen of 4T1 tumor-bearing mice, treated with G-CSF, 20 ng/ml for 6 hr. Data correspond to the mean ± SEM of three individual mice from two experiments. ** P < 0.05, * P < 0.01. D, T cells (CD3+) were isolated by negative selection from spleen of naïve BALB/c mice, mixed with CD11b cells isolated from pancreatic tissue by using CD11b magnetic microbeads (Miltenyi Biotec, San Diego, CA), anti–G-CSF was used in concentration 40 ng/ml. Data correspond to the mean ± SEM of three individual mice. * P < 0.05.
