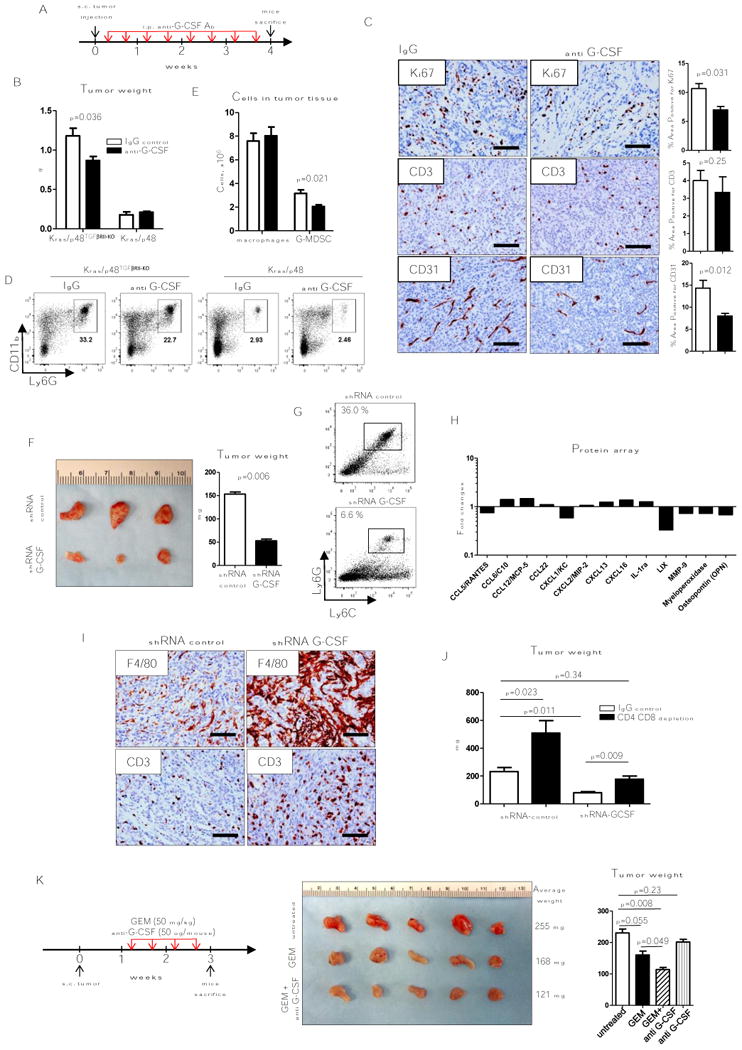
Figure 3. Anti-G-CSF treatment.

A, B, Schematic of treatment with either control (open bars) or anti G-CSF (10 ug/mouse, MAB414; closed bars) and KRas/p48TGFβRII-KO or Kras/p48, tumor weight 4 weeks after s.c. injection of cells (5×10⁵), n = 5. C, IHC for Ki-67, CD3, and CD31 of tumor tissue isolated from mice treated IgG (control group, left column) and mice treated with anti G-CSF (right column) 4 weeks after tumor injection. D, Representative flow cytometry plots of tumor infiltrated immune cells. Cells are gated as CD45+. F, representative photograph of tumor tissue isolated from mice 3 weeks after s.c. injection of shRNA control (clone 1) and shRNA G-CSF (clone 1) carcinoma cells (left) and tumor weight (right), n = 5. G, Representative flow cytometry plots of Ly6G/Ly6C analysis of CD45+CD11b+ cells from tumor tissue shown in F. H, Cytokine array data analysis. CD11b+ cells were isolated from tumor tissue showed on F for collection of conditioned media. Data shows fold changes in shRNA G-CSF tumors vs. shRNA control. Graph shows only proteins with statistically significant changes from total 111 proteins (see details in Material and Methods section), n = 3. I, IHC for F4/80 and CD3 of tumors shown in F. J, Weight of tumor tissue isolated from mice 4 weeks after s.c. injection of shRNA control (clone 2) and shRNA G-CSF (clone 5) carcinoma cells treated in parallel with IgG control (open bars) or depletion due to use of CD4 and CD8 antibody (closed bars). K, Scheme of mice treatment with gemcitabine (GEM) and anti G-CSF. Tumor tissue isolated from mice 3 weeks after s.c. injection of Kras/p48TGFβRII-KO carcinoma cell line and treatment during last 2 weeks (left) and tumor weight (right), n = 5. Scale bars indicate 100 um.
