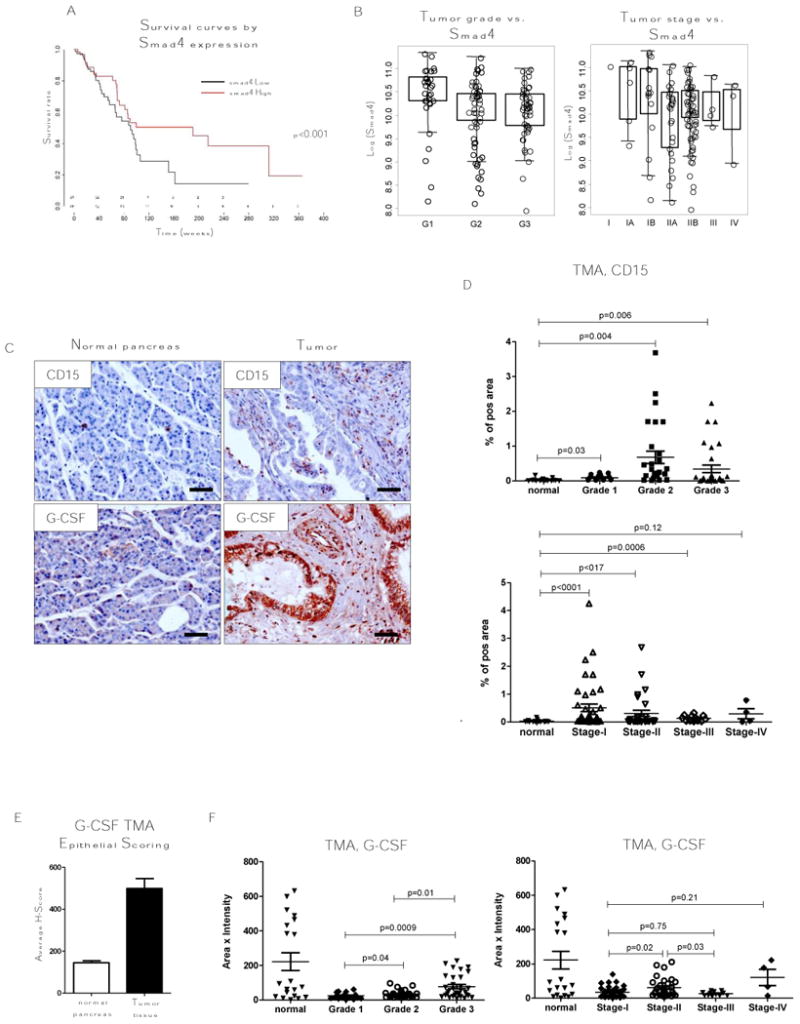
Figure 4. Increased number of CD15+ cells and expression of G-CSF correlates with Grade 1/Stage II in human pancreatic cancer.

A, B, TCGA data set analysis of pancreatic cancer patient survival for Smad4 High and low expressing patients and analysis of Smad4 expression segregated by metastatic incidence, tumor grade, and tumor stage. C, Representative tissue section from TMA stained for CD15 and G-CSF by IHC. D, CD15 and F, G-CSF analysis of TMA staining grouped by grade and tumor stage. Normal, n = 17; tumor, n = 76; grade 1, n = 17; grade 2, n = 28; grade 3, n = 31; stage I, n = 43; stage II, n = 30; stage III, n = 12; stage IV, n = 4. E, Epithelial scoring of G-CSF in TMA used for C, D, F. Scale bars indicate 100 um.
