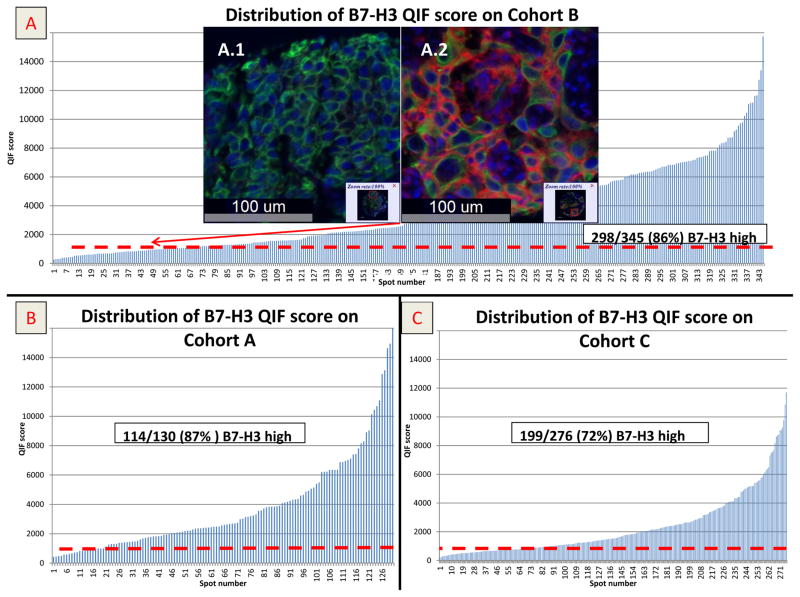
Figure 1.
A) QIF score distribution of tumor B7-H3 protein expression in Cohort B. Scores are expressed as arbitrary units of fluorescence and the dashed red line indicates the signal detection threshold determined by visual cut off as described in the methods; A1 and A2 are examples of TMA spots with negative and positive B7-H3 signal respectively (DAPI in blue, Cytokeratin mask in green (Cy3 channel) and B7-H3 is in red (Cy5 channel), Figure 1B and 1C display QIF score distribution of tumor B7-H3 in Cohort A and C, respectively.

