
Figure 1.
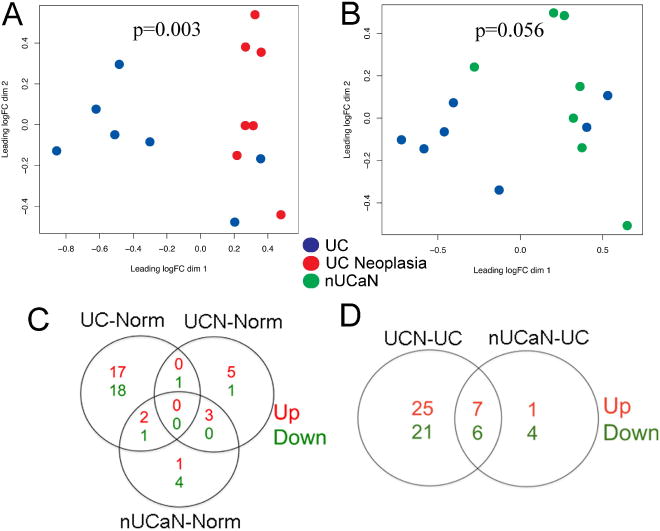
miRNA microarray analysis demonstrates differential expression of miRNAs in normal, UC, UC-neoplasia, and adjacent tissue. Clustering of miRNA expression using non-metric multidimensional scaling in A) UC vs. UC neoplasia, B) nUCaN vs. UC. Each circle represents a single subject in the indicated group. C) Venn diagram displaying the number of significantly up-regulated (red) and down-regulated (green) miRNAs between UC and Normal Controls, UCN and Normal Controls, as well as nUCaN and normal controls (LogFC>1, p<0.01). D) Venn diagram displaying the number of significantly dysregulated miRNAs between UCN and UC as well as nUCaN and UC (LogFC>1, p<0.01). E) miRNAs with a significant difference in expression (fold change >2, p value <0.05) in both UC-associated neoplasia as well as non-dysplastic tissue adjacent to a neoplastic lesion compared to UC without neoplasia.