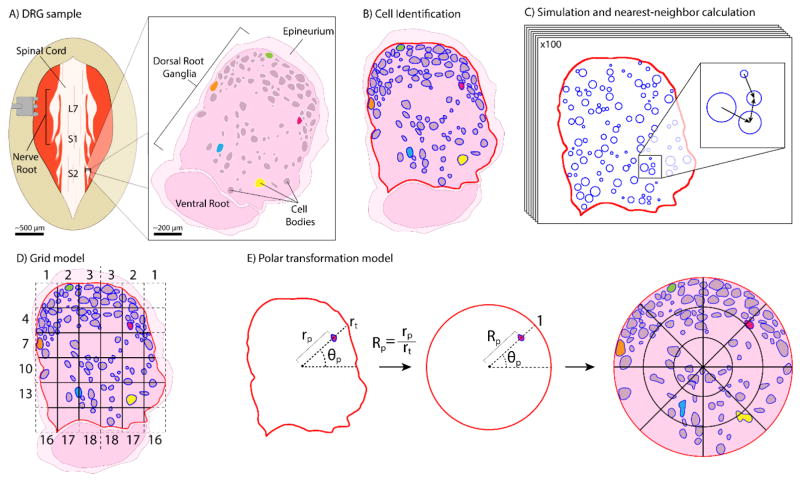
Figure 1.
Representation of tissue collection and analysis methods. (A) Medial tissue slice taken from feline DRG at spinal levels L7-S3. Tissue stained with hematoxylin and eosin, allowing cell bodies to be distinguished from the background. Cell-body containing region is DRG. Several cell bodies highlighted in non-histological colors for clarity through processing steps. (B) Tissue slice oriented with the DRG on top and ventral root underneath. Cell and DRG borders demarcated in blue and red, respectively. (C) MATLAB algorithm used neuronal cell size data and DRG border location to generate 100 random simulations of non-overlapping cell arrangements for comparison to actual arrangement. [inset] Demonstration of nearest-neighbor distance calculation, with arrows pointing toward nearest neighbor of each cell. (D) Division of demarcated DRG into 6×6 grid for calculation of neuronal cell density in each grid square. DRG border takes priority over grid for determining square boundaries. Squares numbered from left to right then top to bottom, with numbers reflected across the vertical axis. (E) For transforming each pixel: angle θp from centroid-horizontal; distance rp from centroid to pixel; distance rt from centroid to DRG border along θp. Transformed polar coordinate is (Rp,θp). [right] Transformed DRG, with a 3×8 radial grid (24 annular sectors) overlaid here for ease of visualization, though a 44×44 radial grid (1,936 annular sectors) was used. Neuronal cell density is calculated in each annular sector, as previously in grid squares.

