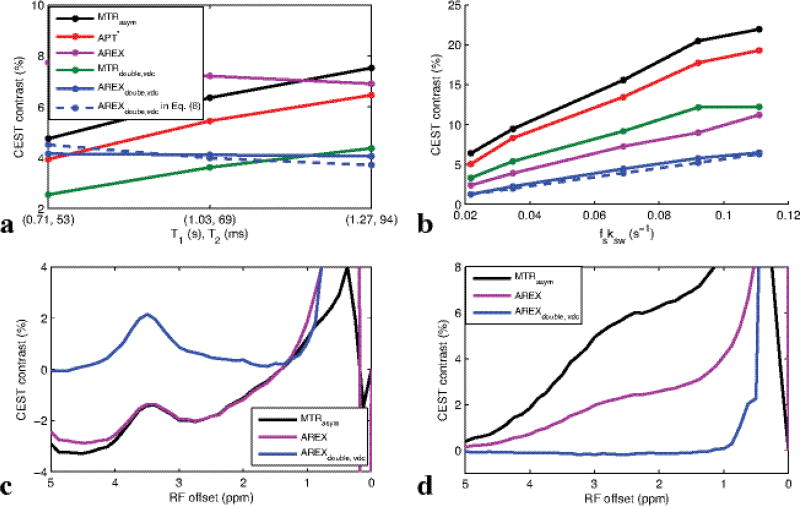
FIG. 5.
Experimental MTRasym, APT*, MTRdouble,vdc, AREX, MTRdouble,vdc, and AREXdouble,vdc of creatine phantoms as a function of measured (T1, T2) (a) and fitted fsksw (b). fs and ksw in (a) were relatively constant, with fitted values of (0.0015, 0.0014, 0.0015) and (59, 50, 46 s−1), respectively, for the three phantoms with varying MnCl2 concentrations. In (b), fsksw values were (0.0217, 0.0347, 0.0689, 0.0921, 0.1109 s−1) for five phantoms with varying pH and creatine concentration. Detailed parameters are listed in Table 1. Only AREX and AREXdouble,vdc show the desired linearity and fs and ksw while being independent of T1 and T2. However, only AREXdouble,vdc avoids contamination by rNOE effects in egg white (c) and amine contributions in glutamate (d), cases where AREX is non-specific similar to conventional MTRasym (which is also plotted in (c) and (d) for comparison)

