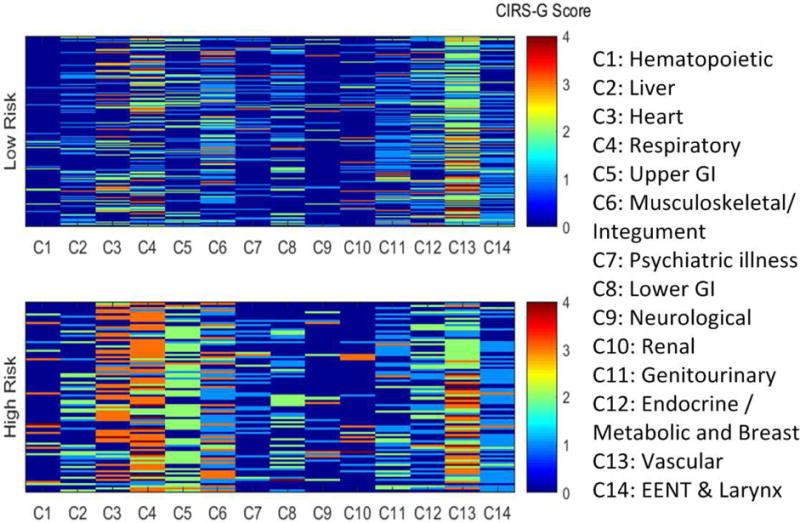
Fig. 3.

Comorbidity heat map for overall survival. Categories on the left have the highest odds ratio for OS. In addition, the heat map allows to visualize how segregated the distribution of comorbidities is between groups. It can be noted that grade 3–4 hematologic, cardiac, and respiratory disease is almost entirely clustered in the high risk group. On the other hand, the association of liver and upper GI diseases with OS is mostly due to grade 2 disease.
