
Figure 1. APOBEC3A is highly expressed in acute myeloid leukemia.
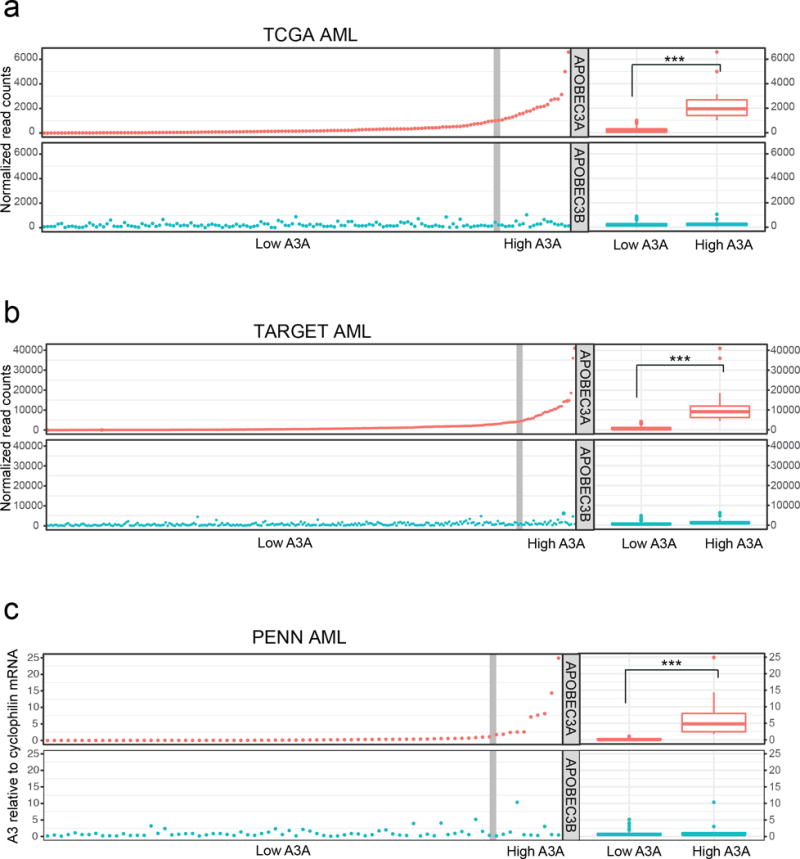
APOBEC3A (red) and APOBEC3B (blue) expression was evaluated in three large cohorts of primary AML. A3 expression in AML samples from the TCGA (a) and TARGET (b) databases was determined by RNA sequencing analysis. Evaluation of A3 mRNA levels in primary AML samples from the University of Pennsylvania (PENN) biological repository (c) was performed by quantitative PCR; A3 mRNA level is displayed as fold change relative to a pooled control. Scatter plots (left) show normalized expression of A3A and A3B in individual samples. Vertical gray line denotes a subset of high A3A expression outliers (right) determined by 1.5× interquartile range. Box plots (far right) display aggregate expression of A3A and A3B in high A3A and low A3A groups. Statistical analysis was performed using the Mann-Whitney U-test.