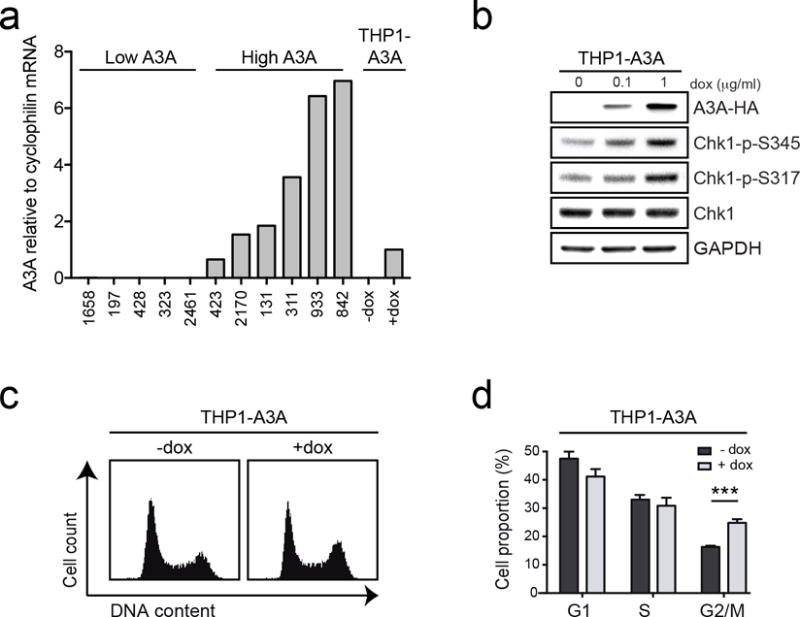
Figure 2. APOBEC3A expression results in ATR activation and checkpoint arrest in AML cells.

The acute myeloid leukemia cell line, THP1, was generated to express A3A upon treatment with doxycycline (dox). (a) Expression levels of A3A in inducible THP1 cells are similar to those of primary AML samples with high A3A expression. Evaluation of A3A mRNA levels was performed by qPCR in THP1-A3A cells treated with dox (1 μg/mL) alongside primary AML samples from the PENN dataset. Primary AML samples included a selection of those with high A3A and low A3A expression. A3A expression level is displayed as fold change relative to dox-treated THP1-A3A cells. (b) ATR signaling is activated by A3A expression. Cells were treated with indicated concentrations of dox and analyzed by immunoblotting using antibodies to HA, Chk1, and phosphorylated Chk1 (S345 and S317). GAPDH was used as a loading control. (c) A3A expression results in G2 arrest. Inducible cells were treated with dox (1 μg/mL) for 48 hours and analyzed for cell cycle progression by propidium iodide staining. (d) Accompanying chart shows fraction of cells in G1, S, and G2 phase pre- and post-induction. Error bars indicate SEM. Statistical analysis was performed using a paired two-tail t test. Results are representative of three independent replicates.
