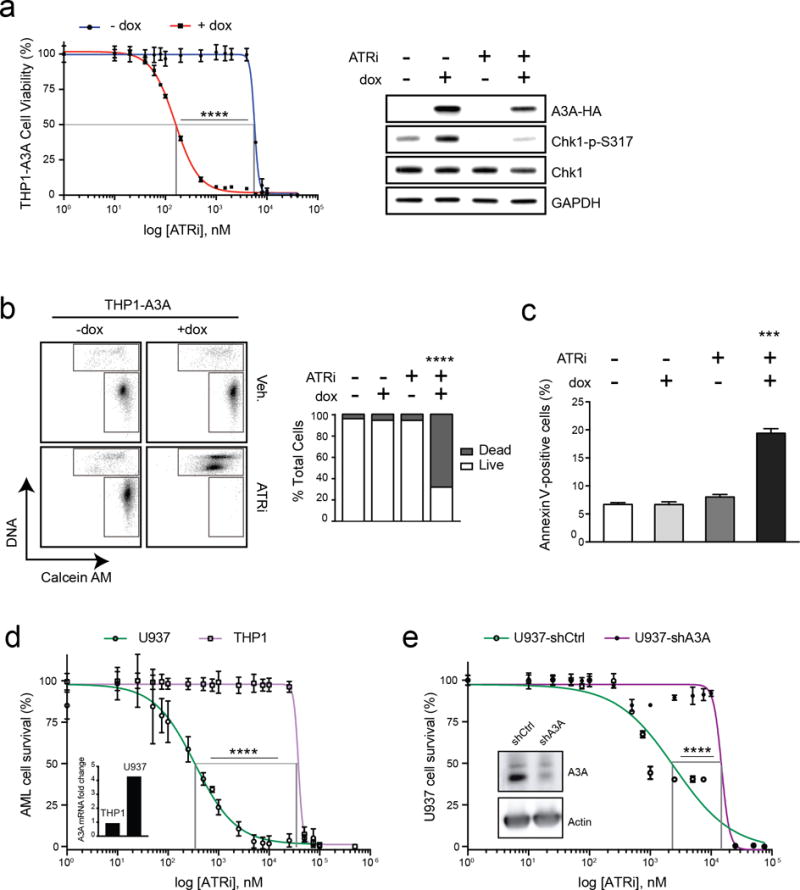
Figure 3. APOBEC3A sensitizes AML cells to ATR inhibition.

(a) A3A expression was induced in THP1-A3A cells by addition of dox (1 μg/mL), and then treated with indicated doses of a small molecule inhibitor of ATR kinase (ATRi, VE-822) 48 hours prior to analysis. Viability was determined by colorimetric change after addition of a water-soluble tetrazolium salt. Statistical analysis of EC50 was performed using a sum-of-squares F-test. Error bars are SEM. Accompanying immunoblot shows impact of ATRi treatment on THP1-A3A cells treated with dox, ATRi (80 nM), or combinations. Cell lysates were probed with antibodies to HA, Chk1, and phosphorylated Chk1. GAPDH was used as loading control. (b) THP1-A3A cells were treated with dox (1 μg/mL), ATRi (200 nM), or combinations, incubated with fluorescent-labeled calcein AM (live) and DNA (dead) stains, then evaluated by FACS. The upper gate includes dead cells and the lower gate includes live cells. Accompanying bar chart shows quantitation of results averaged over three replicates. Statistical analysis was performed using a paired two-tail t-test. Error bars indicate SEM. (c) THP1-A3A cells were treated with 0.1 μg/mL dox, ATRi (80 nM), or combinations. Apoptosis was evaluated by FACS analysis after Annexin V staining and results are displayed as quantitation of three replicate experiments. Statistical analysis was performed using a paired two-tail t test. Error bars indicate SEM. (d) Endogenous A3A expression was evaluated by qPCR in the U937 and THP1 AML cell lines (inset). A3A level is shown as fold-change relative to a pooled control sample. AML cell lines were treated with indicated doses of ATRi for 48 hours prior to analysis of cell viability. (e) Short hairpin RNA (shRNA) was used to deplete endogenous A3A in the U937 AML cell line. Cells transduced with lentivirus containing control (U937-shCtrl) and A3A (U937-shA3A) shRNAs were evaluated by immunoblot using an antibody to endogenous A3A (inset). Actin was used as a loading control. U937 cells were treated with indicated doses of ATRi for 48 hours prior to analysis of cell viability. Statistical analysis of EC50 was performed using a sum-of-squares F-test. Error bars are SEM.
