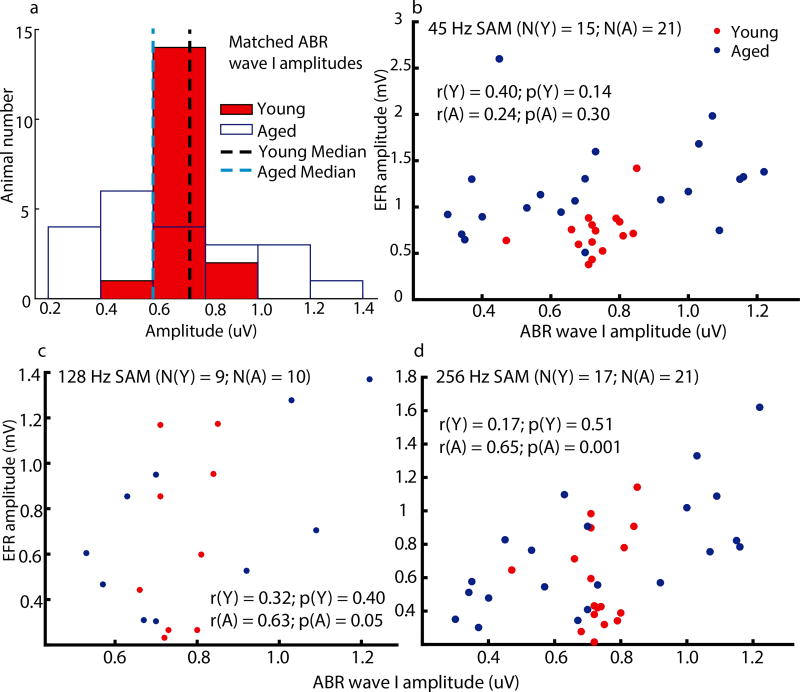
Figure 1. Tone 8 kHz ABR wave I amplitudes of young animals were matched to the median of aged animals’ amplitudes to equate neural excitation in the auditory periphery.
(a) Histograms of tone 8 kHz ABR wave I amplitudes of all young (red solid bars) and aged (white bars) animals show that the range of the younger amplitudes was narrower and their median was close to the aged median. Scatter plots of each individual animal’s EFR amplitude to (b) 45, (c) 128, or (d) 256 Hz at matched ABR wave I amplitude also show that variation was larger in aged animals. In the scatter plots, N denotes number of animals, Y denotes the young, A denotes the aged, r indicates correlation coefficient, and p indicates p-value.

