
Figure 2. Characterization of case-level and clinical-level assertions.
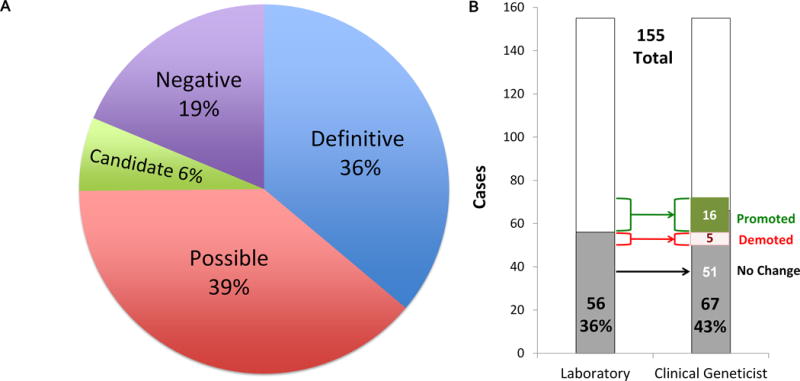
A) The relative percentages of each case-level classification as reported by the testing laboratory. B) The diagnostic rates according to case-level and clinical-level assertions are shown as the proportion of cases, in gray. The change in classification of cases is indicated, with 16 cases promoted and 5 demoted.