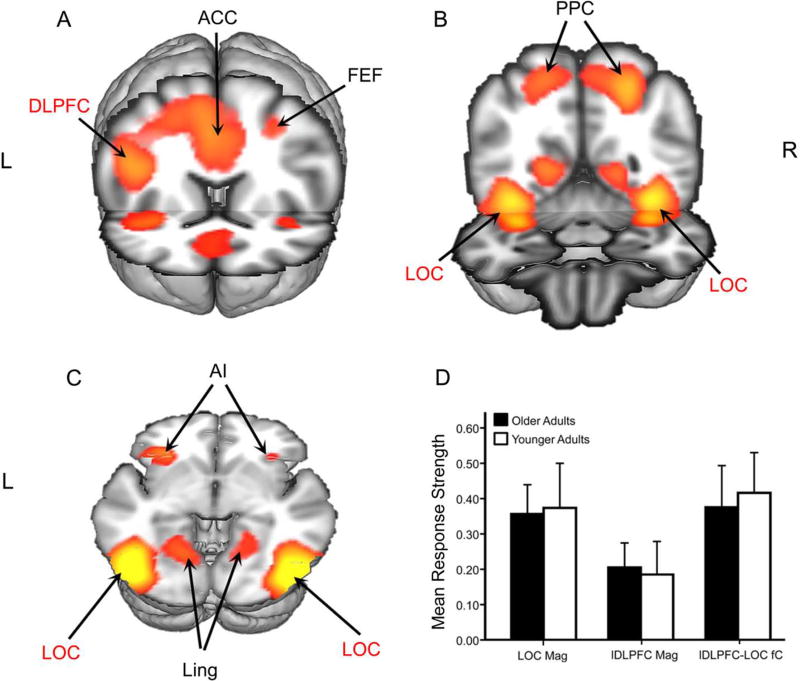
Figure 2.
ICA Results and ROI Mean Values. The main ICA component is shown in coronal (A–B) and axial (C) views. Regions selected for a priori analyses are in red font. ACC: anterior cingulate cortex; FEF: frontal eye fields; AI: anterior insula; DLPFC: dorsolateral prefrontal cortex; LOC: lateral occipital cortex; PPC: posterior parietal cortex; Ling: lingual gyrus. The bar chart summarizes group mean response strengths in the selected ROIs (D). Values for BOLD magnitude represent mean percent signal change between task and baseline in LOC (LOC mag) and lDLPFC (lDLPFC mag). Values for fC represent connectivity scores (lDLPFC-LOC fC).

