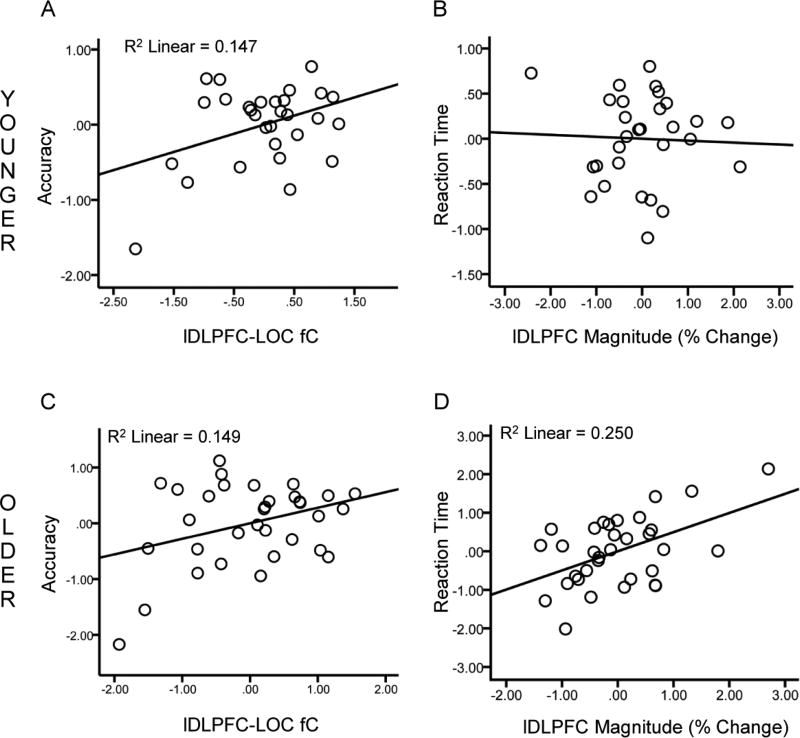
Figure 3.
Relationships between functional activation patterns and performance. Scatter plots of lDLPFC-LOC fC scores against accuracy (A) and lDLPFC BOLD magnitude against RT (B). Values are standardized residuals after controlling for age, sex and education. Significant relationships are shown with lines representing the linear best fit. Results are shown for younger adults (top) and older adults (bottom).

