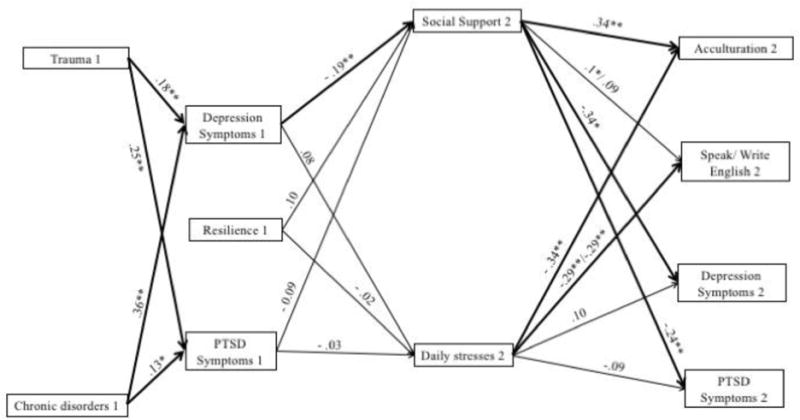
Figure 1.

Path Analysis The model fit the data well (RMSEA = .077; 95% CI = 0.06–0.09; CFI = .96; Chi-Square = 242.53, p<.001). Not all pathways are shown in the model. Additional pathways are reported in Tables 2 and 3. Path beta-coefficients indicate negative (−) and positive associations. Time in study measure was collected: 1=baseline, 2= 1-year follow-up *=P<0.05, **=P<0.01.
