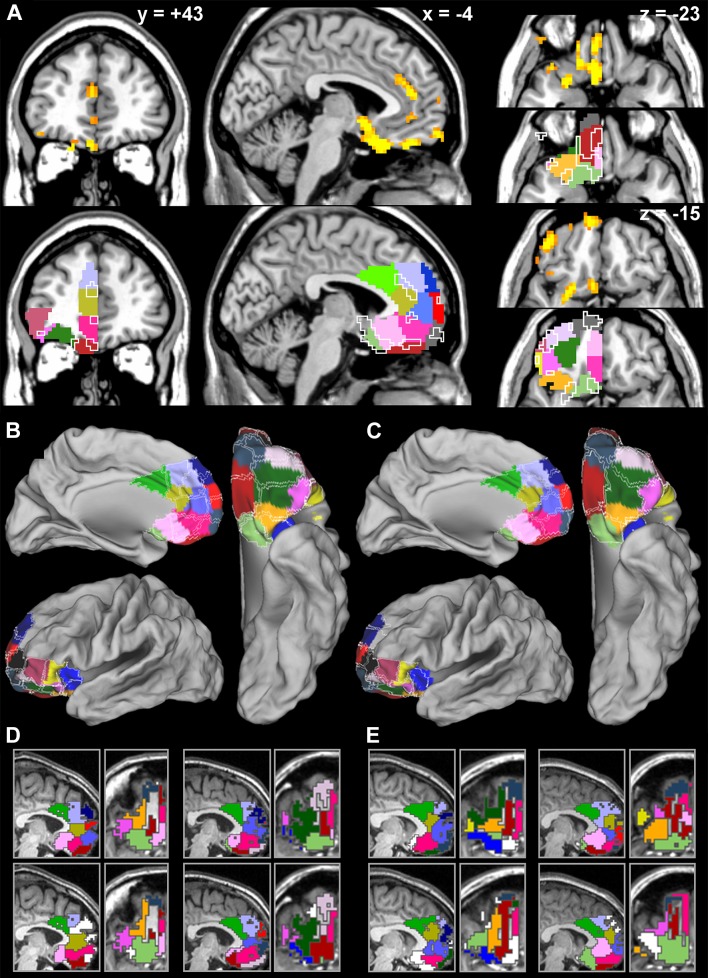
Fig. 2.
Replicability of parcellation results. a Co-localization of within participant reliable boundary voxels across participants. Top row shows voxels with significantly higher replicated boundary values compared to similar replicated boundary measures in null models of randomly located, size-matched modules. Thresholded at t = 3.04, p < 0.05 FDR corrected for multiple comparisons. Bottom row shows the same significant voxel clusters drawn as outlines over the group-wise maximum probability map of the parcellation clusters presented in Fig. 1, to show that mostly the consistently located boundaries overlap the transition between clusters in the maximum probability map. b Replicability of parcellation map across functional runs. Clusters in the left hemisphere of the first resting-state scan (Fig. 1) are plotted in color while the clusters in the left hemisphere of the second resting-state scan are overlaid as borders in white. c Replicability of parcellation map across hemispheres. Clusters in the left hemisphere of the first resting-state scan (Fig. 1) are plotted in color, while the clusters in the right hemisphere are overlaid as borders in white. d Replicability across runs at the level of individual participants. Top panels (medial wall left, orbital surface right) depict parcellation module maps in the left hemisphere of the first resting-state scan in two representative participants. Color coding corresponds to maximum probability cluster map presented in Fig. 1. Bottom panels show the parcellation module maps of the same participants in the left hemisphere of the second resting-state scan. White modules were not assigned to any of the clusters. e Replicability across hemispheres at the level of individual participants. Top panels (medial wall left, orbital surface right) depict parcellation module maps in the left hemisphere of the first resting-state scan in two representative participants. Color coding corresponds to maximum probability cluster map (Fig. 1). Bottom panels show the parcellation module maps of the same participants in the right hemisphere of the same scan. White modules were not assigned to any of the clusters

