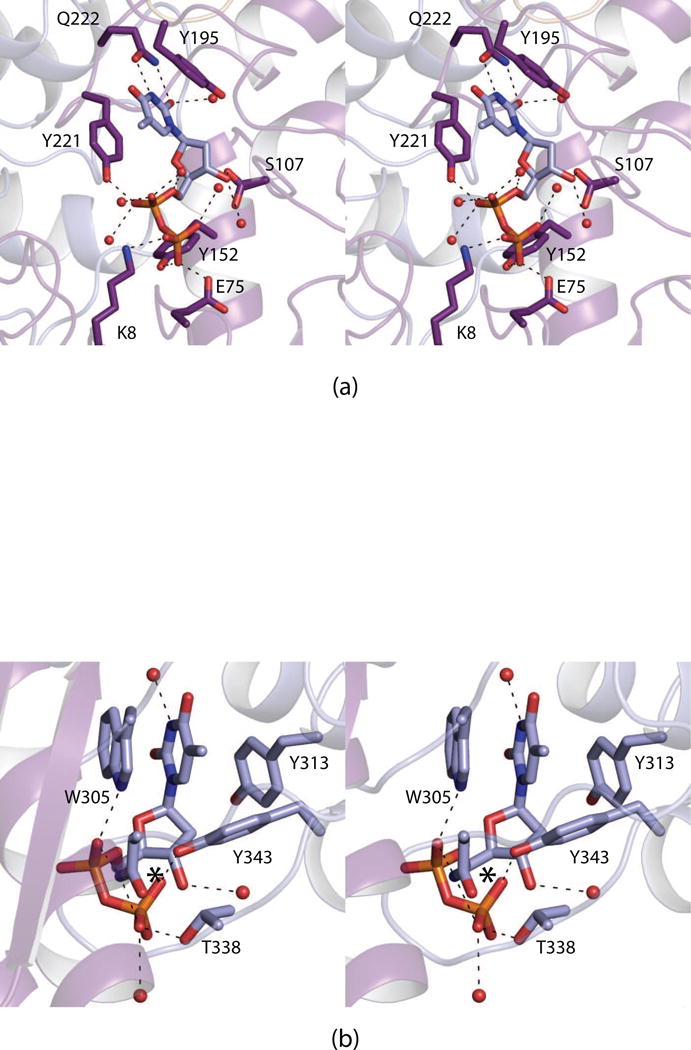
Fig. 2.

Close-up stereo views of the dTDP ligand binding pockets. Shown in (a) and (b) are the protein regions surrounding the ligands in the active site and the auxiliary binding pockets, respectively. Ordered water molecules are represented by the red spheres. Possible hydrogen bonding interactions are indicated by the dashed lines. It was not possible to place a label for Asn 334 in (b) without obscuring its side chain position or the position of β-phosphoryl group of the ligand. Thus, for the sake of clarity, the position of Asn 334 is marked by an asterisk.
