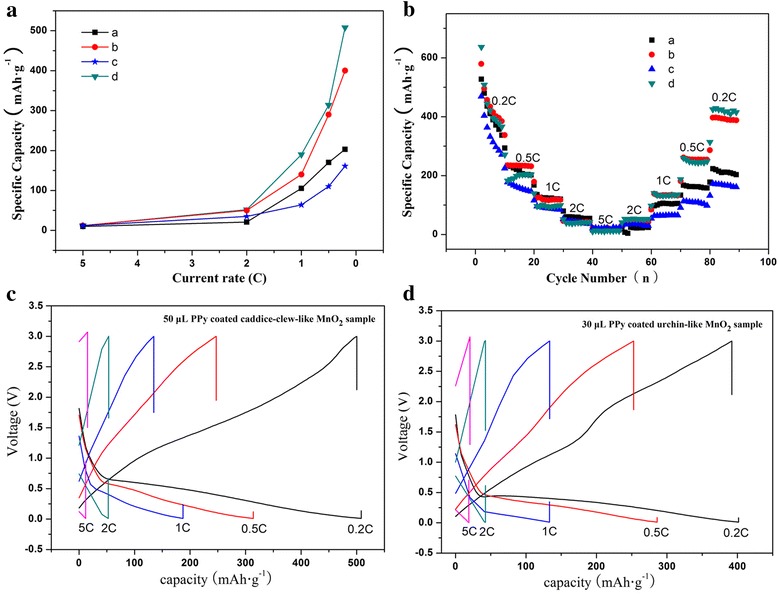
Fig. 7.

a Rate capability, b rate performance, and c, d charge-discharge curves of the MnO2@PPy samples. (a, b) Urchin-like MnO2 sample and 30 μL PPy-coated sample. (c, d) Caddice-clew-like MnO2 sample and 50 μL PPy-coated sample

a Rate capability, b rate performance, and c, d charge-discharge curves of the MnO2@PPy samples. (a, b) Urchin-like MnO2 sample and 30 μL PPy-coated sample. (c, d) Caddice-clew-like MnO2 sample and 50 μL PPy-coated sample