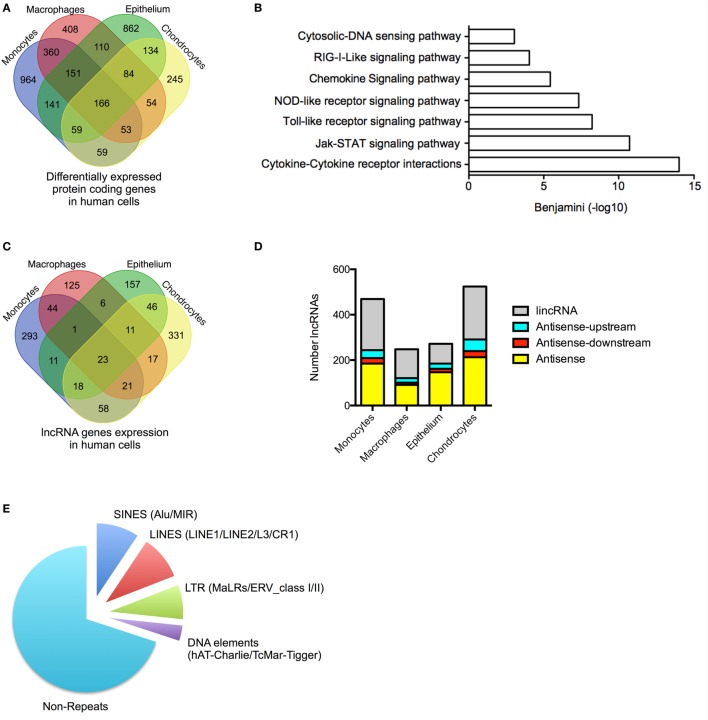
Figure 1.
Profile of messenger RNAs’ (mRNAs) and long non-coding RNAs’ (lncRNAs) expressions in human cells. (A) Venn diagram showing the overlap in the differentially expressed mRNAs following lipopolysaccharides (LPS)-induced activation of monocytes and macrophages or IL1β-induced activation of epithelial cells and chondrocytes at 4 h. (B) Pathways analysis of the mRNAs that were differentially expressed across all human cell types. (C) Venn diagram showing the overlap in the lncRNAs expression profile in resting monocytes, macrophages, epithelial cells, and chondrocytes. (D) Distribution of different antisense and lincRNA species in resting monocytes, macrophages, epithelial cells, and chondrocytes and (E) Pie chart showing the percentage distribution of repeat sequences in the total lncRNA population obtained from all cell types.

