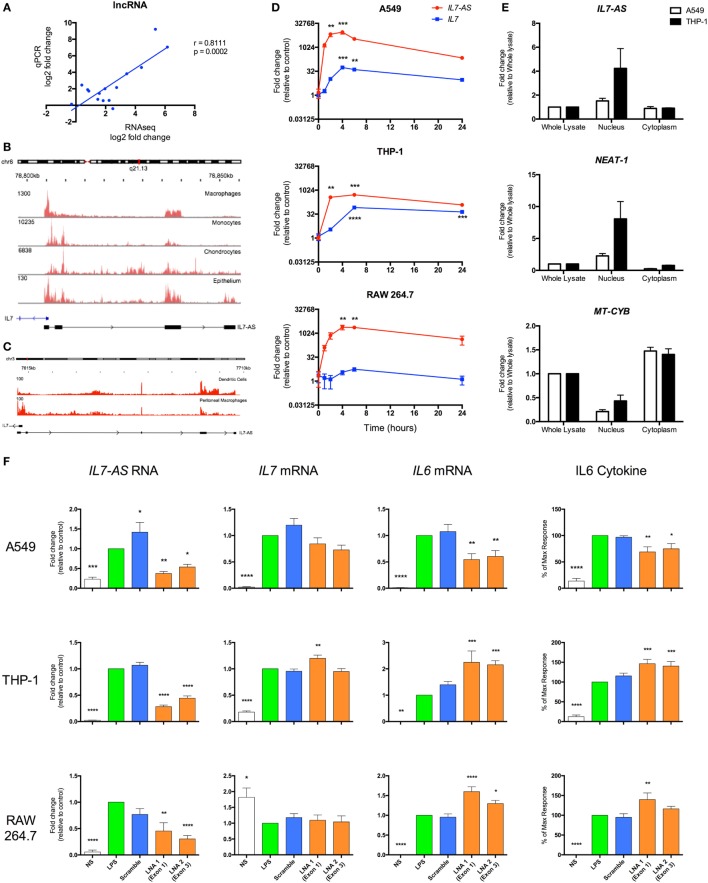
Figure 7.
IL7-AS regulates the expression and release of IL6 from interleukin-1β (IL1β)- and lipopolysaccharides (LPS)-stimulated human and mouse cells. (A) Comparison of fold change in expression of differentially expressed lncRNAs using RNA sequencing and qRT-PCR. Structure and profile of IL7-AS expression in (B) human and (C) mouse cells visualized using the Integrated Genomics Viewer (IGV). (D) Time course of IL7-AS and IL7 mRNA production in IL1β-stimulated human alveolar A549 epithelium and LPS-stimulated human THP1 monocytes and mouse RAW 264.7 macrophages (n = 3 independent experiments). (E) Subcellular distribution of IL7-AS in IL1β-stimulated A549 epithelium and LPS-stimulated THP1 monocytes in which NEAT-1 and mitochondrial-cytochrome b (MT-CYB) are employed as markers of nuclear and cytoplasmic fractions, respectively (n = 4 independent experiments). (F) Effect of transfection with a negative control LNA (scramble) or two antisense LNA (LNA 1 or 2) targeting, respectively, exons 1 and 4 (human cells) or exons 1 and 3 (mouse cells) of IL7-AS at a final concentration of 30 nM. Cells were then treated with either IL1β (30 ng/ml) or LPS (1 µg/ml), or left untreated for 24 h, prior to measurement of levels of the stated gene (by q-PCR) or proteins (by ELISA) (n = 7–8 independent experiments). Statistical significance was performed using either two-way analysis of variance (ANOVA) for time courses or repeated measure one-way ANOVA with both a Dunnett’s post-test correction, where *p < 0.05, **p < 0.01, ***p < 0.001, and ****p < 0.0001 versus control.

