
FIGURE 2.
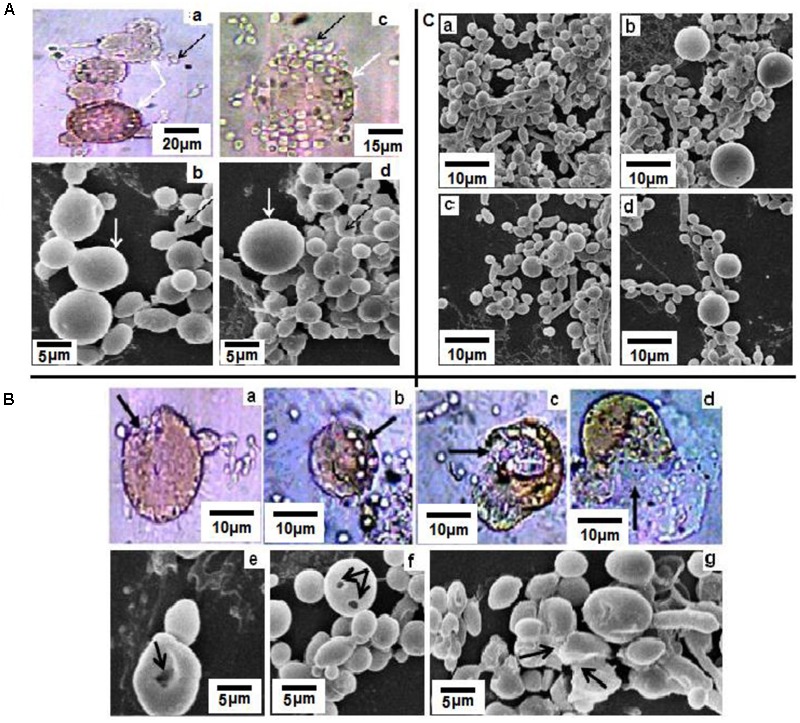
(A) Light (a,c) and scanning electron microscopic (b,d) studies of Candida albicans and ML-CNMA (300 mg⋅l-1 CNMA entrapped ML-CNMA) interaction. Panels (a,b) showed interaction among liposomes, whereas panels (c,d) showed the interaction between the liposome and Candida cells. White arrows indicate liposome whereas black arrows indicate Candida cells. (B) Panels (a,e) showed channels/grooves formed in liposome after attachment of cells, and later elongated Candida cells attached liposome (b,f) formed more grooves. Finally, liposome ruptured (c,d,g) causing release of CNMA, indicated by different black arrows. (C) Control biofilm (a) were treated with ML-CNMA (b–d) with increasing concentration (30, 80, and 300 mg⋅l-1) for 24 h at 37°C. Dissolvent and empty lipid carrier was used as controls.